Quantcast
Channel: Rekall Forensics blog
Viewing all 27 articles
Browse latest View live

Rekall Profiles

$
0
0


Rekall started life as a fork from the Volatility project. Volatility uses profiles to control the parsing of memory. For example, in Volatility one must specify the profile before analysis begins:
$ vol.py -f myimage.dd --profile Win7SP1x86 pslist

What is a profile?

So what is this profile? A profile provides the application with specialized support for precisely the operating system version which is running inside the image. Why do we need specialized support? In order to make sense of the memory image.
Lets take a step back and examine how memory is used by a running computer. The physical memory itself is simply a series of zeros and ones, without any semantic context at all. The processor is free to read/write from arbitrary locations (sans alignment restrictions). However, computer programs need to organize this memory so they can store meaningful data. For example, in the C programming language one can define a struct which specifies how variables are laid out in memory (For all the details see this workshop):
typedef unsigned char uchar;
enum {
OPT1,
OPT2
} options;

struct foobar {
enum options flags;
short int bar;
uchar *foo;
}
Using this information, the compiler can devise a layout of how to store each variable in memory. Since Rekall only receives the memory as a contiguous block of ones and zeros, we need to know where each parameter is laid out in memory.
This problem is actually common to a debugger. The debugger needs to also retrieve the struct members so it can display them to the user. It turns out that to make debugging easier, compilers generate exact layout information for every data type they have. This way the debugger can see where in memory (relative to the struct offset) is each parameter.
Rekall (and Volatility) use this debugging information to know how to extract each struct member from memory. We construct a python data structure which specifies exactly how to extract each field by parsing the debugging symbols.
For example, the above struct foo might by described by:
vtypes = {
'foobar': [12, {
'flags': [0, ['Enumeration', dict(
target="unsigned int",
choices={
1: "OPT1",
2: "OPT2",
},
)]],
'bar: [4, ['unsigned short int']],
'foo: [8, ['Pointer', dict(target="unsigned char")]],
}
Note that:
  • The description is purely data. It consists of field names, offsets and type names.
  • The precise offset of each field is provided explicitly. This is different from many other parsing libraries (e.g. Construct) which require all fields to be specified (or padding fields to be inserted). This special feature allows:
  • To write sparse struct definitions - i.e. definitions where not all the fields are known.
  • Alias fields (e.g. implement a union) where different types are all located in the same memory address.
A profile is actually a collection of such vtype definitions (among other things) which provides the rest of the code with the specific memory layout of the struct members. You can think of it as a template which is overlayed on top of the memory to select the individual field members.
Typically to analyze an operating system, the profile is generated from debugging symbols for the kernel binary itself.

How do we deal with versions?

As operating systems evolve over time, the source code changes in very subtle ways. For example, assume the above struct definition is altered to add an additional field:
struct foobar {
unsigned int new_field;
enum options flags;
short int bar;
uchar *foo;
}
Now to make space for the new field, all subsequent fields are pushed up by 4 bytes. This means the vtype definition we have above is wrong, since the offsets for all the fields have changed. If we tried to use the old template on the memory image from the new operating system, we will think that the new_field is actually flags, the flags field is actually bar etc.
So generally a profile must match the exact version of the operating system kernel we are analyzing. Slight version mismatches might still work but not reliably (Struct definitions which have not changed between versions will continue to work, but if some of the types were slightly modified our analysis will break).
So how does Volatility solve this problem?
  • Volatility has many windows profiles embedded into its source code. For example there is a profile for Windows XP Service Pack 3, one for Windows Vista Service Pack 2 etc. Also included are profiles for the different architectures (x86 and x64).
  • For OSX, one has to download the profile pack from the Volatility site. These are Zip files containing the textual output of dwarfdump (the dump of debugging symbols). When running on an OSX image, Volatility opens the zip file, parses the output of dwarfdump into an in memory python data structure before proceeding with the analysis. Each OSX profile is approximately 1mb, making the entire profile pack around 50mb big.
  • For Linux there are so many versions, that users must build their own by compiling a kernel module in debug mode, and dumping the output of dwarfdump. Again the profile is a zip file containing the output of the linux dwarfdump (which is actually slightly different from the OSX one). Again this must be parsed by the program before any analysis can begin.
There are a number of problems with this approach:
  1. Windows profiles are included in the code base, which means that all windows profiles are always loaded into memory all the time (even when analyzing a different version of windows).
  2. There are about 20-30 different windows profiles. In practice there are hundreds of released builds of the windows kernel. So the profiles that are included in Volatility are only representative to the precise version. As discussed above, one need to have the exact profile version for reliable memory analysis. Hence there is bound to be some variability between the profile version provided by Volatility and the one needed for the actual image.
  3. This is simply not scalable - there is a limit of how many profiles one can include with the code. For OSX the profiles must be downloaded separately, and for linux they must be built. You cant really use it as a library included into a third party with such a huge memory footprint.
  4. It is also very slow. Due to the plugin model in Volatility, profiles are placed inside one of the plugins directory. When Volatility starts up it tries to load all files inside its plugin directory. This means you cant just point Volatility into your profiles directory because it will always try to open every single profile you have in there.
  5. The profile format is not consistent between operating systems. The OSX profiles are parsed using OSX specific parsers, Linux is parsed using a textual based dwarf parser, while windows profiles must be inserted into the code manually.
  6. The profiles are very slow to parse. The dwarfparsers used for Linux and OSX profiles are actually parsing the textual output of the dwarfdump program - this is quite slow and not really needed.
Since it is important to the Rekall project to minimize memory footprint (so it can be used as a library) and also to improve performance, we had to redesign how profiles work:
  • We observed that the profile contains the vtype definitions for the specific operating system involved. The vtype definitions are just a static data structure consisting of lists, dicts, strings and numbers. This means we can store the profile in a data file, instead of embed it as python code.
  • In python, textual parsing is pretty expensive. Especially parsing the output of dwarfdump is pretty slow. We observed that profiles are written only once (when dumping the output of dwarfdump) but are read every single time the tool runs. It therefore makes sense to write the profile in a format which is optimized for loading very fast with minimal parsing. Since the vtype definition is just a data structure, we know that in Python, JSON is the fastest serialization for simple data structures there is. (Maybe cPickle is faster but we wanted to stay away from pickles to enable the safe interchange of profiles).
  • Finally we observed that for Linux and OSX (and actually for windows too, as explained in a future blog post), the zip file contains a number of different types of data. The Zip file contains the vtype description of all the structs using in the kernel, but also it contains the offsets of global symbols (e.g the kernel system map). For analysing these we need both symbols and constants to represent the kernel version.
In Rekall, the profile is a simple data structure (using strings, dict, lists and numbers) which represents a specific version of the kernel. Rather than separate the different types of information (e.g. vtypes and constants) into different members of a zip file, we combine them all into a single dict. Here is an example of a Linux Ubuntu 3.8.0-27 kernel:
{
"$CONSTANTS": {
".brk.dmi_alloc": 18446744071598981120,
".brk.m2p_overrides": 18446744071598964736,
".brk.p2m_identity": 18446744071594827776,
".brk.p2m_mid": 18446744071594831872,
".brk.p2m_mid_identity": 18446744071598927872,
".brk.p2m_mid_mfn": 18446744071596879872,
".brk.p2m_mid_missing": 18446744071594807296,
".brk.p2m_mid_missing_mfn": 18446744071594811392,
".brk.p2m_missing": 18446744071594803200,
".brk.p2m_populated": 18446744071598952448,
....

"$METADATA": {
"ProfileClass": "Linux64",
"Type": "Profile"
},
"$STRUCTS": {
"__raw_tickets": [4, {
"head": [0, ["short unsigned int"]],
"tail": [2, ["short unsigned int"]]
}],
....
We can see that the top level object is a dict, with keys like "$CONSTANTS", "$METADATA", "$STRUCTS". These are called profile sections. For example, the most common sections are:
$CONSTANTS: A dict of constants and their offsets in memory.
$STRUCTS: The vtype description of all structs in this kernel version.
$METADATA: This describes the kernel, it contains the name of the python class that implements this profile, the kernel’s build version, architecture etc.
The whole data structure is serialized using JSON into a file and is loaded at once using pythons json.load() function (This function is actually implemented in C and is extremely fast).
An interesting optimization is the realization that if dictionaries are sorted in the json file, then gzip will work much more effectively (since the data will naturally contain a lot of repeated common prefixes - especially with the very large system map). This makes the JSON files much smaller on disk than the Volatility profiles. For example, the Volatility profile for OSX Lion_10.7_AMD.zip is about 1.2mb while the Rekall profile for the same version is 336kb. Both profiles contain the same information and are both compressed.
The Rekall profile format is standard across all supported operating systems. Even though generating the profiles uses different mechanism for different operating systems (i.e. parsing PDB files for windows, parsing dwarf files for Linux, parsing debug kernels for OSX), the final output is exactly the same. This makes the profile loading code in Rekall much simpler.
It is possible to convert existing Volatility profiles into the Rekall format by using the convert_profile plugin (This might be useful when migrating old profiles from Volatility to Rekall):
$ rekall convert_profile ./profiles/Volatility/SnowLeopard_10.6.6_AMD.zip ./OSX_10.6.6_AMD.json
$ rekall -f OSX_image.dd --profile ./OSX_10.6.6_AMD.json
In a future post we discuss how Rekall profiles are organized into a public profile repository.

Rekall - We can remember it for you wholesale.

$
0
0
Rekall started life as special branch in the Volatility project to explore new approaches of performing some memory analysis. Over time this branch was known as the "scudette" branch after the volatility core developer who performed this work (scudette@gmail.com). For various reasons (which you can read more about in the History section of the README.txt file) this branch evolved into a new project called "Rekall".
Although the Volatility project implements some excellent algorithms, we wanted to improve on the Volatility code by focusing on some areas which we felt were very important. The goals and priorities of the Rekall project are slighly different from the Volatility project’s:
  • Focus on coding style, readability and maintainability.
  • Create modular code which can be used as a library within other tools.
  • Focus on performance. Because we wanted to deploy Rekall to perform Live analysis with GRR we need it to be efficient and robust. It turns out that making it faster also makes the tool more accurate (We will discuss it in another post).
  • Develop and research more accurate, advanced memory analysis techniques.
  • Document all algorithms heavily. The volatility code base lacks much documentation on how algorithms are implemented. There are many "magic" numbers derived by reversing some unknown functions. These are hard to replicate and explain.
We will use this blog as a medium to discuss some of the improvements and research we did in the Rekall project, and the improvements over the Volatility code base. If you have suggestions or contribution, please either add a comment to the page below or send us a mail to rekall-dev@googlegroups.com.
Although we often compare the Rekall implementation to the one in the Volatility project, we do not mean to suggest that the Volatility approach is inferiour. Simply that they are focusing on different aspects of memory analysis. For example, volatility hasn't focused much on performance, but it's one of our current main focus - so we put more effort into optimizing the code for speed.

Currently we are focusing our efforts on the above areas and the tool is not yet officially released as a stable tool. Although it is generally stable, we reserve the right to modify APIs heavily before the final release.
We encourage people to try out the Rekall trunk and send bug reports or open issues with the google code site:
Or the mailing list:

Quick start

Rekall is available as a python package installable via the pip package manager. Simply type (for example on Linux):
sudo pip install rekall
You might need to specifically allow pre-release software to be included (until Rekall makes a major stable release):
sudo pip install --pre rekall
To have all the dependencies installed. You still need to have python and pip installed first.
To be able to run the ipython notebook, the following are also required:
pip install Jinja2 MarkupSafe Pygments astroid pyzmq tornado wsgiref
For windows, Rekall is also available as a self contained installer package. Please check the download page for the most appropriate installer to use (http://downloads.rekall.googlecode.com/git/index.html)

Development version

For development it is easier to install rekall inside a virtual env. Virtual Env is a way for containing and running multiple versions of python packages at the same time, without interfering with the host system.
# You might need to install virtualenv:
$ sudo apt-get install python-virtualenv

# This will build a new empty python environment.
$ virtualenv /tmp/Test

# Now we switch to the environment - all python code runs from here.
$ source /tmp/Test/bin/activate

# This will install all dependencies into the virtual environment.
$ pip install --pre rekall

# For development run the devel version - this will symlink your virtual
# environment with the source tree so when you make changes to the source they
# appear immediately in the code (without needing to install them to the
# environment first).

$ git clone https://code.google.com/p/rekall/
$ cd rekall
$ python setup.py develop

The Rekall Profile Repository and Profile Auto-selection

$
0
0
The previous blog post discussed how Rekall redesigned the profile format into a simple JSON data structure. The profile JSON file now becomes the complete information source about a specific kernel version - including global constants, struct definitions (via vtype definitions) and metadata (such as architecture, version etc).
One important difference from the Volatility profiles, is that in Rekall, the profile is the actual json file itself, while in Volatility a profile name represents a specific class defined within the code base. So for example, with Rekall one can specify the profile as a path to a file (which may be compressed):
$ rekall -f OSX_image.dd --profile ./OSX_10.6.6_AMD.json.gz

The Rekall public repository.

Since the profile file is just data, it can be hosted in a public repository. Rekall can simply download the required profile from the repository when required. This makes it much easier to distribute the code since we do not need to include vast quantities of unnecessary information embedded inside the program.
Rekall provides a public repository located at http://profiles.rekall.googlecode.com/git/ . The Rekall team collects profiles for the most common operating system versions, and we try to increase our coverage as much as possible.
For example, we can see what Rekall is doing when loading an OSX profile:
$ rekall -f memory_vm_10_7.dd.E01 --profile OSX/10.7.4_AMD -v pslist
DEBUG:root:Opened url http://profiles.rekall.googlecode.com/git//OSX/10.7.4_AMD.gz
INFO:root:Loaded profile OSX/10.7.4_AMD from URL:http://profiles.rekall.googlecode.com/git/
DEBUG:root:Voting round
DEBUG:root:Trying <class 'rekall.plugins.addrspaces.macho.MACHOCoreDump'>
DEBUG:root:Failed instantiating MACHOCoreDump: Must stack on another address space
....
Rekall contacts the default public profile repository to load the specified profile and continues running.

Alternate Repositories

Although it is very convenient to use the public repository, sometimes we can not or do not want to. For example, if we do not have adequate Internet access on the analysis system we might not be able to use the public repository.
Since the profile repository is just a git repository, its easy to mirror it locally. The following will create a directory called rekall.profiles containing the most up to date version of the public repository:
$ git clone https://code.google.com/p/rekall.profiles

# It is possible to update the local mirror with the latest public profiles.
$ cd rekall.profiles
rekall.profiles$ git pull

# Now we can tell Rekall to use the local repository
$ rekall -f memory_vm_10_7.dd.E01 --profile_path full_path_to_rekall.profiles \
--profile OSX/10.7.4_AMD -v pslist
To save typing, it is possible to just change the local rekall configuration to point at the profile repository by default. Simply edit the ~/.rekallrc file (Which is a configuration file in YAML format):
profile_path:
- /home/scudette/projects/rekall.profiles
- http://profiles.rekall.googlecode.com/git/
The profile_path parameter specifies a list of paths to search for the specified profile in order. If we place the public repository in the second position, rekall will only attempt to contact the public repository if the required profile does not exist in the local mirror.
This is useful if you are doing a lot of analysis for unusual Linux systems (i.e. ones with uncommon or custom compiled kernels). In that case you can put your private profiles in a local directory, but still fall back to the public repository for common profiles.

Windows profiles.

Putting the profile data in the public repository helps to reduce code footprint. While removing the embedded volatility profiles from the code base it because obvious that Volatility does not actually contain enough windows kernel vtypes to cover all the different windows releases out there.
As described in the previous blog post, the profile contains information specific to a single build of the windows kernel. Each time the windows kernel source code is modified and rebuilt, a new profile should be generated. In reality, Microsoft rebuilds and redistributes the windows kernel multiple times during a single marketed release, and even multiple times for different release markets. We know this because each time an executable is built, it contains a new GUID embedded in it.
Note
How does the Microsoft compiler generate debugging symbols?
When an executable is built, the compiler places the debugging symbols in a separate file (with a .pdb extension). The final executable contains a special structure called an RSDS signature (This is not the official name since this is not exactly documented, but the string "RSDS" actually appears in the executable).
The RSDS structure contains three critical pieces of information:
  • The GUID - a random number unique to each built binary.
  • The filename of the pdb file which goes with the binary.
  • An age. This is a number usually single digit like 2 or 3.
Microsoft typically does not ship the debugging information in order to save space on distribution media. Instead, they provide a public symbols server. One can access the debugging symbols for each built binary (if they are released of course), by simply providing the GUID, age and the filename of the pdb file.
Of course the infrastructure that Microsoft provides is there to serve the windows kernel debugger, but we can leverage this same infrastructure in Rekall. In a sense Rekall is emulating the windows debugger to some extent when analyzing a windows memory dump.
You can check the exact kernel version running in a memory image using Rekall’s RSDS scanner:
$ rekall -f win7.elf version_scan --name_regex krnl
Offset (P) GUID/Version PDB
-------------- -------------------------------- ------------------------------
0x0000027bb5fc F8E2A8B5C9B74BF4A6E4A48F180099942 ntkrnlmp.pdb
Here we see that this image contains a specific version with the GUID F8E2A8B5C9B74BF4A6E4A48F180099942. We actually can check the GUIDs from the binary on disk for the windows kernel.
I was curious as to how many different kernel binaries exist in the wild? I began to collect GUIDs for various versions of Windows, generate profiles for these and put them in the profile repository. I have found approximately 200 profiles of the windows kernel (ntoskrnl.exe and its variants) with different architectures (AMD64 and I386), versions and build numbers. For example Windows XP Service Pack 2 has a build number of 2600 but we found over 30 different versions in the wild.
The profile repository contains a special type of profile definition which is a Symlink. For example, we define a profile called Win7SP1x64 which contains:
{
"$METADATA": {
"Type": "Symlink",
"Target": "ntoskrnl.exe/AMD64/6.1.7601.17514/3844DBB920174967BE7AA4A2C20430FA2"
}
}
This just selects a representative profile from the many Windows 7 Service Pack 1 profiles we have. This allows Rekall to be used in backwards compatibility mode:
$ rekall -f ~/images/win7.elf -v --profile Win7SP1x64 pslist
DEBUG:root:Opened url http://profiles.rekall.googlecode.com/git//Win7SP1x64.gz
DEBUG:root:Opened url http://profiles.rekall.googlecode.com/git//ntoskrnl.exe/AMD64/6.1.7601.17514/3844DBB920174967BE7AA4A2C20430FA2.gz
INFO:root:Loaded profile ntoskrnl.exe/AMD64/6.1.7601.17514/3844DBB920174967BE7AA4A2C20430FA2 from URL:http://profiles.rekall.googlecode.com/git/
INFO:root:Loaded profile Win7SP1x64 from URL:http://profiles.rekall.googlecode.com/git/
....
We can see that first the Symlink profile is opened, followed by the real profile.

What profile do I need?

Have you even been given an image of a windows version, but you don’t know exactly which one it is supposed to be? Is it a 64 bit system or a 32 bit system? Is it Windows 7 or Windows XP? Is it Service Pack 1 or 2?
Volatility has the imageident plugin which load all the windows profiles it knows about (about 20 different ones) and tries to fit them to the image. Its very slow and often does not work.
The easier way is simply check the RSDS signature of the windows kernel:
$ rekall -f win7.elf version_scan --name_regex krnl
Offset (P) GUID/Version PDB
-------------- -------------------------------- ------------------------------
0x0000027bb5fc F8E2A8B5C9B74BF4A6E4A48F180099942 ntkrnlmp.pdb
The Rekall public repository organizes windows profiles using two hierarchies, the first is by binary name, architecture and build version, for example:
ntoskrnl.exe/I386/5.1.2600.1151/04FB9A156FF44ECCA6EBCAE9617D8DB73.gz
However a more useful organization is by GUID (since the GUID is universally unique). If we know the GUID we can automatically access the correct profile without needing to know if it is Windows 7, WinXP or whatever:
$ rekall -f ~/images/win7.elf -v --profile GUID/F8E2A8B5C9B74BF4A6E4A48F180099942 pslist
DEBUG:root:Opened url http://profiles.rekall.googlecode.com/git//GUID/F8E2A8B5C9B74BF4A6E4A48F180099942.gz
DEBUG:root:Opened url http://profiles.rekall.googlecode.com/git//ntoskrnl.exe/AMD64/6.1.7600.16385/F8E2A8B5C9B74BF4A6E4A48F180099942.gz
INFO:root:Loaded profile ntoskrnl.exe/AMD64/6.1.7600.16385/F8E2A8B5C9B74BF4A6E4A48F180099942 from URL:http://profiles.rekall.googlecode.com/git/
INFO:root:Loaded profile GUID/F8E2A8B5C9B74BF4A6E4A48F180099942 from URL:http://profiles.rekall.googlecode.com/git/
....
This method is actually extremely reliable since it will retrieve exactly the correct profile according to the RSDS header we find. Rekall uses this method by default to guess the required profile to use. Therefore normally users do not really need to provide the profile explicitly to Rekall:
$ rekall -f ~/images/win7.elf -v pslist
DEBUG:root:Voting round
DEBUG:root:Trying <class 'rekall.plugins.addrspaces.macho.MACHOCoreDump'>
.....
INFO:root:Autodetected physical address space Elf64CoreDump
DEBUG:root:Opened url http://profiles.rekall.googlecode.com/git//pe.gz
INFO:root:Loaded profile pe from URL:http://profiles.rekall.googlecode.com/git/
DEBUG:root:Verifying profile GUID/F8E2A8B5C9B74BF4A6E4A48F180099942
DEBUG:root:Opened url http://profiles.rekall.googlecode.com/git//GUID/F8E2A8B5C9B74BF4A6E4A48F180099942.gz
DEBUG:root:Opened url http://profiles.rekall.googlecode.com/git//ntoskrnl.exe/AMD64/6.1.7600.16385/F8E2A8B5C9B74BF4A6E4A48F180099942.gz
INFO:root:Loaded profile ntoskrnl.exe/AMD64/6.1.7600.16385/F8E2A8B5C9B74BF4A6E4A48F180099942 from URL:http://profiles.rekall.googlecode.com/git/
INFO:root:Loaded profile GUID/F8E2A8B5C9B74BF4A6E4A48F180099942 from URL:http://profiles.rekall.googlecode.com/git/
DEBUG:root:Found _EPROCESS @ 0x2818140 (DTB: 0x187000)
We can see that Rekall initially fetches the pe profile (so it can parse the RSDS header), when a hit is found, the profile repository is search by the GUID. This is found as a symlink to an actual profile from a Windows 7 version.

What if the profile repository does not have my exact version?

As mentioned above we are still building the repository up as a public service, and it may be that we do not have the profile for the exact version in your memory image. You will typically see something like this:
$ rekall -f ~/images/win7.elf -v pslist
DEBUG:root:Opened url http://profiles.rekall.googlecode.com/git//GUID/F8E1A8B5C9B74BF4A6E4A48F180099942
DEBUG:root:Could not find profile GUID/F8E1A8B5C9B74BF4A6E4A48F180099942 in http://profiles.rekall.googlecode.com/git/
DEBUG:root:Could not find profile GUID/F8E1A8B5C9B74BF4A6E4A48F180099942 in None
Traceback (most recent call last):
File "/home/scudette/VirtualEnvs/Dev/bin/rekall", line 9, in <module>
load_entry_point('rekall==1.0rc3', 'console_scripts', 'rekall')()
File "/home/scudette/rekall/rekall/rekal.py", line 145, in main
flags = args.parse_args(argv=argv, user_session=user_session)
File "/home/scudette/rekall/rekall/args.py", line 218, in parse_args
LoadProfileIntoSession(parser, argv, user_session)
File "/home/scudette/rekall/rekall/args.py", line 194, in LoadProfileIntoSession
state.Set(arg, value)
File "/home/scudette/rekall/rekall/session.py", line 169, in __exit__
self.session.UpdateFromConfigObject()
File "/home/scudette/rekall/rekall/session.py", line 210, in UpdateFromConfigObject
self.profile = self.LoadProfile(profile_parameter)
File "/home/scudette/rekall/rekall/session.py", line 464, in LoadProfile
filename)
ValueError: Unable to load profile GUID/F8E1A8B5C9B74BF4A6E4A48F180099942 from any repository.
Although you could maybe substitute a generic profile (like Win7SP1x64 as described above). This is really not recommended and will probably stop working at some point in the future (as Rekall uses more advanced analysis methods which depend on accurate profiles).
The correct solution is to generate your own profile like this:
# First find the GUID of the kernel in your image
$ rekall -f win7.elf version_scan --name_regex krnl
Offset (P) GUID/Version PDB
-------------- -------------------------------- ------------------------------
0x0000027bb5fc F8E2A8B5C9B74BF4A6E4A48F180099942 ntkrnlmp.pdb

# Then fetch the GUID from Microsoft's symbol server.
$ rekall fetch_pdb -D. --guid F8E2A8B5C9B74BF4A6E4A48F180099942 --filename ntkrnlmp.pdb
Trying to fetch http://msdl.microsoft.com/download/symbols/ntkrnlmp.pdb/F8E2A8B5C9B74BF4A6E4A48F180099942/ntkrnlmp.pd_
Received 2675077 bytes
Extracting cabinet: ntkrnlmp.pd_
extracting ntkrnlmp.pdb

All done, no errors.

# Now Generate the profile from the pdb file. You will need to provide the
# approximate windows version.
$ rekall parse_pdb -f ntkrnlmp.pdb --output F8E2A8B5C9B74BF4A6E4A48F180099942.json --win 6.1
Extracting OMAP Information 62%
Please send us that GUID so we can add it to our repository. If you have a local repository you can just add it to your own repository (under the GUID/ directory).

Summary

  • Rekall has moved the profiles out of the code base
  • Profiles are now stored in their own unique repository.
  • Profiles are now much more accurate since they are exactly tailored to the specific version of the kernel in the memory image, rather than guessing approximate representative profiles by commercial release names (e.g. Win7).
  • Rekall also implements a robust profile auto-detection method. The user rarely needs to explicitly provide the profile on the command line, and detection is extremely fast and reliable.

Do we need the Kernel Debugging Block?

$
0
0
I have written a blog article in the past describing the Kernel Debugging Block (KDBG) in detail http://scudette.blogspot.ch/2012/11/finding-kernel-debugger-block.html as it is used by Volatility in order to "bootstrap" the analysis process. Many plugins require a list of processes, and Volatility uses the KDBG in order to locate the PsActiveProcessHead symbol (which is the head of the doubly linked list holding the _EPROCESS objects together).
Recently, the Volatility blog reminded us that the KDBG is critical for memory analysis. In that post, the author recognizes that the KDBG block is encoded on Window 8 and is not readily scanned for using the usual kdbgscan plugin. In particular that blog post states:
An encoded KDBG can have a hugely negative effect on your ability to perform memory forensics. This structure contains a lot of critical details about the system, including the pointers to the start of the lists of active processes and loaded kernel modules, the address of the PspCid handle table, the ranges for the paged and non-paged pools, etc. If all of these fields are encoded, your day becomes that much more difficult.
We have previously demonstrated in our OSDFC training workshop that the KDBG block can be trivially overwritten without affecting system stability. Since the kdbgscan plugin simply scans for the plain text "KDBG" signature, by overwriting this signature it is impossible to locate the KDBG, nor bootstrap memory analysis. Indeed with Volatility you are going to have a really bad day. It is still possible to workaround this limitation, and our workshop describes all the workarounds available, but it is definitely not ideal.
This problem was also discussed in the Black Hat talk One-byte Modification for Breaking Memory Forensic Analysis.

Does Rekall use the KDBG?

Volatility windows profiles are typically generated using the pdbparse project, using the  pdb_tpi_vtypes.py script. They normally only contain the vtype definitions (embedded into python files, for example vista_sp0_x64_vtypes.py).
While developing the Rekall profile system (which is described in detail in previous blog posts), new profiles were generated for windows kernels. Rather than rely on the pdbparse project to parse the pdb files, we have implemented a complete Microsoft PDB parser within the Rekall framework (This will be described in a future blog post).
Microsoft PDB files contain a number of streams. One of the streams describes struct definitions and can be used to generate the vtypes. However, interestingly, there are a few more streams which extract global symbols from the PDB file. (The pdbparse project does provide am additional script to extract the constants from the pdb file, but that script is not currently used by Volatility).
In other words, the PDB file contains the addresses in memory of many symbols. This is akin to the System.map file we use when analyzing a Linux memory image. Lets examine a typical Rekall windows profile:
{
"$CONSTANTS": {
.....
"PromoteNode": 611168,
"PropertyEval": 451884,
"PsAcquireProcessExitSynchronization": 1157620,
"PsActiveProcessHead": 96160,
"PsAssignImpersonationToken": 1479504,
"PsBoostThreadIo": 219912,
....
"KdD3Transition": 805316,
"KdDebuggerDataBlock": 2003056,
"KdDebuggerEnabled": 2562992,
"KdDebuggerInitialize0": 805256,
"KdDebuggerInitialize1": 805244,
...
We can see that the typical Microsoft kernel PDB file contains a huge number of symbols which are not exported in the PE export table. In particular we see the symbol PsActiveProcessHead which is required to list processes. We also see the exact location of the Kernel Debugger block in KdDebuggerDataBlock symbol (Just in case we need it). The symbol offset is specified relative to the Kernel Base address (i.e. the MZ header where the kernel is mapped into memory).
Let us examine in detail the steps that Rekall goes through in the pslist module by enabling verbose logging:
$ rekall --verbose -f  ~/images/win7.elf pslist
.....
INFO:root:Autodetected physical address space Elf64CoreDump 1
DEBUG:root:Opened url http://profiles.rekall.googlecode.com/git//pe.gz
INFO:root:Loaded profile pe from URL:http://profiles.rekall.googlecode.com/git/ 2
DEBUG:root:Verifying profile GUID/F8E2A8B5C9B74BF4A6E4A48F180099942 3
DEBUG:root:Opened url http://profiles.rekall.googlecode.com/git//GUID/F8E2A8B5C9B74BF4A6E4A48F180099942.gz
DEBUG:root:Opened url http://profiles.rekall.googlecode.com/git//ntoskrnl.exe/AMD64/6.1.7600.16385/F8E2A8B5C9B74BF4A6E4A48F180099942.gz
INFO:root:Loaded profile ntoskrnl.exe/AMD64/6.1.7600.16385/F8E2A8B5C9B74BF4A6E4A48F180099942 from URL:http://profiles.rekall.googlecode.com/git/
INFO:root:Loaded profile GUID/F8E2A8B5C9B74BF4A6E4A48F180099942 from URL:http://profiles.rekall.googlecode.com/git/
DEBUG:root:Found _EPROCESS @ 0x2818140 (DTB: 0x187000) 4
INFO:root:Detected ntkrnlmp.pdb with GUID F8E2A8B5C9B74BF4A6E4A48F180099942
Offset (V) Name PID PPID Thds Hnds Sess Wow64 Start Exit
-------------- -------------------- ------ ------ ------ -------- ------ ------ ------------------------ ------------------------
INFO:root:Detected kernel base at 0xF8000261F000 5
0xfa80008959e0 System 4 0 84 511 ------ False 2012-10-01 21:39:51+0000 -
0xfa8001994310 smss.exe 272 4 2 29 ------ False 2012-10-01 21:39:51+0000 -
0xfa8002259060 csrss.exe 348 340 9 436 0 False 2012-10-01 21:39:57+0000 -
1Rekall auto-detects this image as contained in an EWF file.
2Rekall now contacts the profile repository to retrieve the parser for the PE file format.
3The PE profile is used to scan for RSDS signatures. These are verified so we can be pretty confident that we loaded the exact profile for this image.
4The Kernel DTB is located by scanning for the Idle process.
5We now find the kernel’s base address. Once that is known, the addresses of all symbols in the kernel’s virtual address space are known directly from the profile. i.e. We do not need to scan for anything, we already know where everything is.
Rekall generally does not need to use the KDBG at all. This is much faster since it does not need to scan for it, but more importantly, is much more robust because malware can not overwrite thePsActiveProcessHead symbol without crashing the system.
Since Rekall uses a profile repository we are able to locate the exact profile for the kernel we are analyzing. Therefore we do not need to scan for anything - we always prefer to just read the exact addresses from the profile without guessing. This makes analysis far more robust and simple.

Another example, the callbacks plugin.

Another example of this technique is the callbacks plugin. Here, Volatility resorts to disassembling various exported functions to try to locate the offset of a number of non-exported callback pointer tables (e.g. PsSetLoadImageNotifyRoutine is disassembled to get to PspLoadImageNotifyRoutine). This algorithm is pretty fragile and complex. It also only works on 32 bit systems at the moment, since signatures need to be developed for different architectures.
However, this algorithm is entirely not needed, if one uses the correct profile for the exact kernel version. You can simply look up the exact addresses of the (non-exported) symbols you need. Here is the Rekall code:
        routines = ["_PspLoadImageNotifyRoutine",             1
"_PspCreateThreadNotifyRoutine",
"_PspCreateProcessNotifyRoutine"]

for symbol in routines:
# The list is an array of 8 _EX_FAST_REF objects
addrs = self.profile.get_constant_object( 2
symbol,
target="Array",
target_args=dict(
count=8,
target='_EX_FAST_REF')
)

for addr in addrs: 3
callback = addr.dereference_as("_GENERIC_CALLBACK")
if callback:
yield "GenericKernelCallback", callback.Callback, None
1We look up each one of these symbols by name.
2We use the profile directly to instanstiate an array of 8 _EX_FAST_REF.
3We dereference each of the addresses to find the callbacks.
There is no need to scan or disassemble anything to retrieve the symbol addresses, since we know exactly where they are already.

What else can we do with profile constants?

The amount of information provided in the kernel PDB files is truly extensive. Not only does Microsoft provide non-exported function names, but also global names, string names, import table entries and much more.
This is extremely useful when disassembling code in Rekall. Since Rekall disassembles the code which is resident in memory, all relocations, imports, exports etc have already been done by the kernel. In other words if we see a memory reference, we can resolve it to know where it is or what it is without considering imports.
Here is an example of disassembling the PsSetLoadImageNotifyRoutine routine on a 64 bit image (This is what Volatility is doing in the callbacks plugin).
$ rekall -f  ~/images/win7.elf dis 'ntoskrnl.exe!PsSetLoadImageNotifyRoutine'
Address Rel Op Codes Instruction Comment
-------------- ---- -------------------- ------------------------------ -------
------ ntoskrnl.exe!PsSetLoadImageNotifyRoutine ------
0xf80002aa1050 0 48895c2408 MOV [RSP+0x8], RBX
0xf80002aa1055 5 57 PUSH RDI
0xf80002aa1056 6 4883ec20 SUB RSP, 0x20
0xf80002aa105a A 33d2 XOR EDX, EDX
0xf80002aa105c C e8bfb1feff CALL 0xf80002a8c220 ntoskrnl.exe!ExAllocateCallBack
0xf80002aa1061 11 488bf8 MOV RDI, RAX
0xf80002aa1064 14 4885c0 TEST RAX, RAX
0xf80002aa1067 17 7507 JNZ 0xf80002aa1070 ntoskrnl.exe!PsSetLoadImageNotifyRoutine + 0x20
0xf80002aa1069 19 b89a0000c0 MOV EAX, 0xffffffffc000009a
0xf80002aa106e 1E eb4a JMP 0xf80002aa10ba ntoskrnl.exe!PsSetLoadImageNotifyRoutine + 0x6A
0xf80002aa1070 20 33db XOR EBX, EBX
0xf80002aa1072 22 488d0d27d4d9ff LEA RCX, [RIP-0x262bd9] 0xFFFFF8A0001310BF ntoskrnl.exe!PspLoadImageNotifyRoutine
0xf80002aa1079 29 4533c0 XOR R8D, R8D
0xf80002aa107c 2C 488bd7 MOV RDX, RDI
0xf80002aa107f 2F 488d0cd9 LEA RCX, [RCX+RBX*8]
0xf80002aa1083 33 e8c817f8ff CALL 0xf80002a22850 ntoskrnl.exe!ExCompareExchangeCallBack
0xf80002aa1088 38 84c0 TEST AL, AL
0xf80002aa108a 3A 7511 JNZ 0xf80002aa109d ntoskrnl.exe!PsSetLoadImageNotifyRoutine + 0x4D
0xf80002aa108c 3C ffc3 INC EBX
0xf80002aa108e 3E 83fb08 CMP EBX, 0x8
0xf80002aa1091 41 72df JB 0xf80002aa1072 ntoskrnl.exe!PsSetLoadImageNotifyRoutine + 0x22
0xf80002aa1093 43 488bcf MOV RCX, RDI
0xf80002aa1096 46 e805e9f5ff CALL 0xf800029ff9a0 ntoskrnl.exe!IopDeallocateApc
0xf80002aa109b 4B ebcc JMP 0xf80002aa1069 ntoskrnl.exe!PsSetLoadImageNotifyRoutine + 0x19
0xf80002aa109d 4D f083053bd4d9ff01 LOCK ADD DWORD [RIP-0x262bc5], 0x1 0x1 ntoskrnl.exe!PspLoadImageNotifyRoutineCount
0xf80002aa10a5 55 8b05d5d3d9ff MOV EAX, [RIP-0x262c2b] 0x7 ntoskrnl.exe!PspNotifyEnableMask
0xf80002aa10ab 5B a801 TEST AL, 0x1
0xf80002aa10ad 5D 7509 JNZ 0xf80002aa10b8 ntoskrnl.exe!PsSetLoadImageNotifyRoutine + 0x68
0xf80002aa10af 5F f00fba2dc8d3d9ff00 LOCK BTS DWORD [RIP-0x262c38], 0x0 0x7 ntoskrnl.exe!PspNotifyEnableMask
0xf80002aa10b8 68 33c0 XOR EAX, EAX
0xf80002aa10ba 6A 488b5c2430 MOV RBX, [RSP+0x30]
0xf80002aa10bf 6F 4883c420 ADD RSP, 0x20
0xf80002aa10c3 73 5f POP RDI
We can see that addresses are resolved according to the known symbols at that address (In the Volatility code we are actually after the PspLoadImageNotifyRoutine address).

How to stop memory acquisition by changing one byte.

$
0
0

In our recent paper, we examined memory acquisition in details and tested a bunch of tools. Memory acquisition tools have to achieve two tasks to be useful:
  1. They need to be able to map a region of physical memory into the virtual address space, so it can be read by the tool.
  2. They need to know where in the physical address space it is safe to read. Reading a DMA mapped region will typically crash the system (BSOD).
Since PCI devices are able to map DMA buffers into the physical address space, it is not safe to read these buffers. When a read operation occurs on the memory bus for these addresses, the device might become activated and cause a system crash or worse. The memory acquisition tool needs to be able to avoid these DMA mapped regions in order to safely acquire the memory.
Let us see what occurs when one loads the memory acquisition driver. Since our goal is to play around with memory modification, we will enable write support for the winpmem acquisition tool (This example uses a Windows 7 AMD64 VM):
In [2]:
!c:/Users/mic/winpmem_write_1.5.5.exe -l -w
Enabling write mode.
Driver Unloaded.
Loaded Driver C:\Users\mic\AppData\Local\Temp\pmeE820.tmp.
Write mode enabled! Hope you know what you are doing.
CR3: 0x0000187000
2 memory ranges:
Start 0x00001000 - Length 0x0009E000
Start 0x00100000 - Length 0x7CEF0000
Acquisition mode PTE Remapping


We see that winpmem extracts its driver to a temporary location, and loads it into the kernel. It then reports the value of the Control Register CR3 (This is the kernel's Directory Table Base - or DTB).
Next we see that the driver is reporting the ranges of physical memory available on this system. There are two ranges on this system with a gap in between. To understand why this is let's consider the boot process:
  • When the system boots, the BIOS configures the initial physical memory map. The RAM in the system is literally installed at various ranges in the physical address space by the BIOS.
  • The operating system is booted in Real mode, at which point a BIOS service interrupt is issued to query this physical memory configuration. It is only possible to issue this interrupt in Real mode.
  • During the OS boot sequence, the processor is switched to protected mode and the operating system continues booting.
  • The OS configures PCI devices by talking to the PCI controller and mapping each PCI device's DMA buffer (plug and play) into one of the gaps in the physical address space. Note that these gaps may not actually be backed by any RAM chips at all (which means that a write to that location will simply not stick - reading it back will produce 0).
The important thing to take from this is that the physical memory configuration is done by the machine BIOS on its own (independent of the running operating system). The OS kernel needs to live with whatever configuration the hardware boots with. The hardware will typically install some gaps in the physical address range so that PCI devices can be mapped inside them (Some PCI devices can only address 4GB so there must be sufficient space in the lower 4GB of physical address space for these.).
Since the operating system can only query the physical memory map when running in real mode, but needs to use it to configure PCI devices while running in protected mode, there must be a data structure somewhere which keeps this information around. When WinPmem queries for this information, it can not be retrieved directly from the BIOS - since the machine is already running in protected mode.
The usual way to get the physical memory ranges is to call MmGetPhysicalMemoryRanges(). This is the function API:
PPHYSICAL_MEMORY_DESCRIPTOR NTAPI MmGetPhysicalMemoryRanges(VOID);
We can get Rekall to disassemble this function for us. First we initialize the notebook, opening the winpmem driver to analyze the live system. Since Rekall uses exact profiles generated from accurate debugging information for the running system, it can resolve all debugging symbols directly. We therefore can simply disassemble the function by name:
In [2]:
fromrekallimportinteractive
interactive.ImportEnvironment(filename=r"\\.\pmem")
Initializing Rekall session.
Done!

In [3]:
dis"nt!MmGetPhysicalMemoryRanges"
   Address      Rel Op Codes             Instruction                    Comment
-------------- ---- -------------------- ------------------------------ -------
------ nt!MmGetPhysicalMemoryRanges ------
0xf80002cd9690 0 488bc4 MOV RAX, RSP
0xf80002cd9693 3 48895808 MOV [RAX+0x8], RBX
0xf80002cd9697 7 48896810 MOV [RAX+0x10], RBP
0xf80002cd969b B 48897018 MOV [RAX+0x18], RSI
0xf80002cd969f F 48897820 MOV [RAX+0x20], RDI
0xf80002cd96a3 13 4154 PUSH R12
0xf80002cd96a5 15 4155 PUSH R13
0xf80002cd96a7 17 4157 PUSH R15
0xf80002cd96a9 19 4883ec20 SUB RSP, 0x20
0xf80002cd96ad 1D 65488b1c2588010000 MOV RBX, [GS:0x188]
0xf80002cd96b6 26 41bf11000000 MOV R15D, 0x11
0xf80002cd96bc 2C 4533e4 XOR R12D, R12D
0xf80002cd96bf 2F f6835904000020 TEST BYTE [RBX+0x459], 0x20
0xf80002cd96c6 36 458d6ff0 LEA R13D, [R15-0x10]
0xf80002cd96ca 3A 7405 JZ 0xf80002cd96d1 nt!MmGetPhysicalMemoryRanges + 0x41
0xf80002cd96cc 3C 418bfc MOV EDI, R12D
0xf80002cd96cf 3F eb2a JMP 0xf80002cd96fb nt!MmGetPhysicalMemoryRanges + 0x6B
0xf80002cd96d1 41 66ff8bc6010000 DEC WORD [RBX+0x1c6]
0xf80002cd96d8 48 33c0 XOR EAX, EAX
0xf80002cd96da 4A f04c0fb13de5e4dcff LOCK CMPXCHG [RIP-0x231b1b], R15 0x0 nt!MmDynamicMemoryLock
0xf80002cd96e3 53 740c JZ 0xf80002cd96f1 nt!MmGetPhysicalMemoryRanges + 0x61
0xf80002cd96e5 55 488d0ddce4dcff LEA RCX, [RIP-0x231b24] 0x0 nt!MmDynamicMemoryLock
0xf80002cd96ec 5C e83f00c3ff CALL 0xf80002909730 nt!ExfAcquirePushLockShared
0xf80002cd96f1 61 808b5904000020 OR BYTE [RBX+0x459], 0x20
0xf80002cd96f8 68 418bfd MOV EDI, R13D
0xf80002cd96fb 6B 488b053679e3ff MOV RAX, [RIP-0x1c86ca] 0xFFFFFA8001793FD0 nt!MmPhysicalMemoryBlock
0xf80002cd9702 72 33c9 XOR ECX, ECX
0xf80002cd9704 74 41b84d6d5068 MOV R8D, 0x68506d4d
0xf80002cd970a 7A 8b10 MOV EDX, [RAX]
0xf80002cd970c 7C 4103d5 ADD EDX, R13D
0xf80002cd970f 7F c1e204 SHL EDX, 0x4
0xf80002cd9712 82 e8f944d3ff CALL 0xf80002a0dc10 nt!ExAllocatePoolWithTag
0xf80002cd9717 87 488be8 MOV RBP, RAX
0xf80002cd971a 8A 493bc4 CMP RAX, R12
0xf80002cd971d 8D 7545 JNZ 0xf80002cd9764 nt!MmGetPhysicalMemoryRanges + 0xD4
0xf80002cd971f 8F 413bfd CMP EDI, R13D
0xf80002cd9722 92 7539 JNZ 0xf80002cd975d nt!MmGetPhysicalMemoryRanges + 0xCD
0xf80002cd9724 94 498bc7 MOV RAX, R15
0xf80002cd9727 97 f04c0fb12598e4dcff LOCK CMPXCHG [RIP-0x231b68], R12 0x0 nt!MmDynamicMemoryLock
0xf80002cd9730 A0 740c JZ 0xf80002cd973e nt!MmGetPhysicalMemoryRanges + 0xAE
0xf80002cd9732 A2 488d0d8fe4dcff LEA RCX, [RIP-0x231b71] 0x0 nt!MmDynamicMemoryLock
0xf80002cd9739 A9 e80655bfff CALL 0xf800028cec44 nt!ExfReleasePushLockShared
0xf80002cd973e AE 80a359040000df AND BYTE [RBX+0x459], 0xdf
0xf80002cd9745 B5 664401abc6010000 ADD [RBX+0x1c6], R13W
0xf80002cd974d BD 750e JNZ 0xf80002cd975d nt!MmGetPhysicalMemoryRanges + 0xCD
0xf80002cd974f BF 488d4350 LEA RAX, [RBX+0x50]

Note that Rekall is able to resolve the addresses back to the symbol names by using debugging information. This makes reading the disassembly much easier. We can see that this function essentially copies the data referred to from the symbol nt!MmPhysicalMemoryBlock into user space.
Lets dump this memory:
In [8]:
dump"nt!MmPhysicalMemoryBlock",rows=2
    Offset                           Hex                              Data       Comment
-------------- ------------------------------------------------ ---------------- -------
0xf80002b11038 d0 3f 79 01 80 fa ff ff 01 00 01 00 fe 3d 09 a1 .?y..........=.. nt!MmPhysicalMemoryBlock + 0
0xf80002b11048 a0 a8 83 01 80 fa ff ff 70 6a 7b 01 80 fa ff ff ........pj{..... nt!IoFileObjectType + 0

This appears to be an address, lets dump it:
In [10]:
dump0xfa8001793fd0,rows=4
    Offset                           Hex                              Data       Comment
-------------- ------------------------------------------------ ---------------- -------
0xfa8001793fd0 02 00 00 00 00 00 00 00 8e cf 07 00 00 00 00 00 ................
0xfa8001793fe0 01 00 00 00 00 00 00 00 9e 00 00 00 00 00 00 00 ................
0xfa8001793ff0 00 01 00 00 00 00 00 00 f0 ce 07 00 00 00 00 00 ................
0xfa8001794000 fe ff ff ff ff ff ff ff ff ff ff ff ff ff ff ff ................

The data at this location contains a struct of type _PHYSICAL_MEMORY_DESCRIPTOR which is also the return value from the MmGetPhysicalMemoryRanges()call. We can use Rekall to simply construct this struct at this location and print out all its members.
In [12]:
memory_range=session.profile._PHYSICAL_MEMORY_DESCRIPTOR(0xfa8001793fd0)
printmemory_range
[_PHYSICAL_MEMORY_DESCRIPTOR _PHYSICAL_MEMORY_DESCRIPTOR] @ 0xFA8001793FD0
0x00 NumberOfRuns [unsigned long:NumberOfRuns]: 0x00000002
0x08 NumberOfPages [unsigned long long:NumberOfPages]: 0x0007CF8E
0x10 Run <Array 2 x _PHYSICAL_MEMORY_RUN @ 0xFA8001793FE0>


In [13]:
forrinmemory_range.Run:
printr
[_PHYSICAL_MEMORY_RUN Run[0] ] @ 0xFA8001793FE0
0x00 BasePage [unsigned long long:BasePage]: 0x00000001
0x08 PageCount [unsigned long long:PageCount]: 0x0000009E

[_PHYSICAL_MEMORY_RUN Run[1] ] @ 0xFA8001793FF0
0x00 BasePage [unsigned long long:BasePage]: 0x00000100
0x08 PageCount [unsigned long long:PageCount]: 0x0007CEF0


So what have we found?
  • There is a symbol called nt!MmPhysicalMemoryBlock which is a pointer to a _PHYSICAL_MEMORY_DESCRIPTOR struct.
  • This struct contains the total number of runs, and a list of each run in pages (0x1000 bytes long).
Lets write a Rekall plugin for this:
In [15]:
fromrekall.plugins.windowsimportcommon

classWinPhysicalMap(common.WindowsCommandPlugin):
"""Prints the boot physical memory map."""

__name="phys_map"

defrender(self,renderer):
renderer.table_header([
("Physical Start","phys","[addrpad]"),
("Physical End","phys","[addrpad]"),
("Number of Pages","pages","10"),
])

descriptor=self.profile.get_constant_object(
"MmPhysicalMemoryBlock",
target="Pointer",
target_args=dict(
target="_PHYSICAL_MEMORY_DESCRIPTOR",
))

formemory_rangeindescriptor.Run:
renderer.table_row(
memory_range.BasePage*0x1000,
(memory_range.BasePage+memory_range.PageCount)*0x1000,
memory_range.PageCount)
This plugin will be named phys_map and essentially creates a table with three columns. The memory descriptor is created directly from the profile, then we iterate over all the runs and output the start and end range into the table.
In [16]:
phys_map
Physical Start  Physical End  Number of Pages
-------------- -------------- ---------------
0x000000001000 0x00000009f000 158
0x000000100000 0x00007cff0000 511728

So far, this is a pretty simple plugin. However, lets put on our black hat for a sec.
In our DFRWS 2013 paper we pointed out that since most memory acquisition tools end up calling MmGetPhysicalMemoryRanges() (all the ones we tested at least), then by disabling this function we would be able to sabotage all memory acquisition tools. This turned out to be the case, however, by patching the running code in memory we would trigger Microsoft's Patch Guard. In our tests, we disabled Patch Guard to prove the point, but this is less practical in a real rootkit.
In reality, a rootkit would like to be able to modify the underlying data structure behind the API call itself. This is much easier to do and wont modify any kernel code, thereby bypassing Patch Guard protections.
To test this, we can do this directly from Rekall's interactive console.
In [18]:
descriptor=session.profile.get_constant_object(
"MmPhysicalMemoryBlock",
target="Pointer",
target_args=dict(
target="_PHYSICAL_MEMORY_DESCRIPTOR",
)).dereference()

printdescriptor
[_PHYSICAL_MEMORY_DESCRIPTOR Pointer] @ 0xFA8001793FD0
0x00 NumberOfRuns [unsigned long:NumberOfRuns]: 0x00000002
0x08 NumberOfPages [unsigned long long:NumberOfPages]: 0x0007CF8E
0x10 Run <Array 2 x _PHYSICAL_MEMORY_RUN @ 0xFA8001793FE0>


Since we loaded the memory driver with write support, we are able to directly modify each field in the struct. For this proof of concept we simply set the NumberOfRuns to 0, but a rootkit can get creative by modifying the runs to contain holes located in strategic regions. By specifically crafting a physical memory descriptor with a hole in it, we can cause memory acquisition tools to just skip over some region of the physical memory. The responders can then walk away thinking they have their evidence, but critical information is missing.
In [19]:
descriptor.NumberOfRuns=0
Now we can repeat our phys_map plugin, but this time, no runs will be found:
In [20]:
phys_map
Physical Start  Physical End  Number of Pages
-------------- -------------- ---------------

To unload the driver, we need to close any handles to it. We then try to acquire a memory image in the regular way.
In [32]:
session.physical_address_space.close()
In [2]:
!c:/Users/mic/winpmem_write_1.5.5.exe test.raw
Driver Unloaded.
Loaded Driver C:\Users\mic\AppData\Local\Temp\pme3879.tmp.
Will generate a RAW image
CR3: 0x0000187000
0 memory ranges:
Acquitision mode PTE Remapping

Driver Unloaded.

This time, however, Winpmem reports no memory ranges available. The result image is also 0 bytes big:
In [3]:
!dir test.raw
 Volume in drive C has no label.
Volume Serial Number is 6438-7315

Directory of C:\Users\mic

03/07/2014 12:02 AM 0 test.raw
1 File(s) 0 bytes
0 Dir(s) 3,416,547,328 bytes free

At this point, running the dumpit program from moonsols will cause the system to immediately reboot. (It seems that dumpit is unable to handle 0 memory ranges gracefully and crashes the kernel).

How stable is this?

We have just disabled a kernel function, but this might de-stabilize the system. What other functions in the kernel are calling MmGetPhysicalMemoryRanges?
Lets find out by disassembling the entire kernel. First we need to find the range of memory addresses the kernel code is in. We use the peinfo plugin to show us the sections which are mapped into memory.

In [2]:
peinfo"nt"
Attribute            Value
---------------------- -----
Machine              IMAGE_FILE_MACHINE_AMD64
TimeDateStamp 2009-07-13 23:40:48+0000
Characteristics IMAGE_FILE_EXECUTABLE_IMAGE, IMAGE_FILE_LARGE_ADDRESS_AWARE
GUID/Age F8E2A8B5C9B74BF4A6E4A48F180099942
PDB ntkrnlmp.pdb
MajorOperatingSystemVersion 6
MinorOperatingSystemVersion 1
MajorImageVersion 6
MinorImageVersion 1
MajorSubsystemVersion 6
MinorSubsystemVersion 1

Sections (Relative to 0xF8000261F000):
Perm Name VMA Size
---- -------- -------------- --------------
xr- .text 0x000000001000 0x00000019b800
xr- INITKDBG 0x00000019d000 0x000000003a00
These are Executable sections.
xr- POOLMI 0x0000001a1000 0x000000001c00
xr- POOLCODE 0x0000001a3000 0x000000003000
xrw RWEXEC 0x0000001a6000 0x000000000000

-r- .rdata 0x0000001a7000 0x00000003ca00
-rw .data 0x0000001e4000 0x00000000fc00
-r- .pdata 0x000000278000 0x00000002fa00
-rw ALMOSTRO 0x0000002a8000 0x000000000800
-rw SPINLOCK 0x0000002aa000 0x000000000a00
xr- PAGELK 0x0000002ac000 0x000000014c00
xr- PAGE 0x0000002c1000 0x000000232600
xr- PAGEKD 0x0000004f4000 0x000000004e00
xr- PAGEVRFY 0x0000004f9000 0x000000021600
xr- PAGEHDLS 0x00000051b000 0x000000002800
xr- PAGEBGFX 0x00000051e000 0x000000006800

-rw PAGEVRFB 0x000000525000 0x000000000000
-r- .edata 0x000000529000 0x000000010a00
-rw PAGEDATA 0x00000053a000 0x000000004c00
-r- PAGEVRFC 0x000000548000 0x000000002a00
-rw PAGEVRFD 0x00000054b000 0x000000001400
xrw INIT 0x00000054d000 0x000000056c00
-r- .rsrc 0x0000005a4000 0x000000035e00
-r- .reloc 0x0000005da000 0x000000002200

Data Directories:
- VMA Size
---------------------------------------- -------------- --------------
IMAGE_DIRECTORY_ENTRY_EXPORT 0xf80002b48000 0x000000010962
IMAGE_DIRECTORY_ENTRY_IMPORT 0xf80002bc1cec 0x000000000078
IMAGE_DIRECTORY_ENTRY_RESOURCE 0xf80002bc3000 0x000000035d34
IMAGE_DIRECTORY_ENTRY_EXCEPTION 0xf80002897000 0x00000002f880
IMAGE_DIRECTORY_ENTRY_SECURITY 0xf80002b5ec00 0x000000001c50
IMAGE_DIRECTORY_ENTRY_BASERELOC 0xf80002bf9000 0x000000002078
IMAGE_DIRECTORY_ENTRY_DEBUG 0xf800027bb5c0 0x000000000038
IMAGE_DIRECTORY_ENTRY_COPYRIGHT 0x000000000000 0x000000000000
IMAGE_DIRECTORY_ENTRY_GLOBALPTR 0x000000000000 0x000000000000
IMAGE_DIRECTORY_ENTRY_TLS 0x000000000000 0x000000000000
IMAGE_DIRECTORY_ENTRY_LOAD_CONFIG 0x000000000000 0x000000000000
IMAGE_DIRECTORY_ENTRY_BOUND_IMPORT 0x000000000000 0x000000000000
IMAGE_DIRECTORY_ENTRY_IAT 0xf800027c6000 0x000000000380
IMAGE_DIRECTORY_ENTRY_DELAY_IMPORT 0x000000000000 0x000000000000
IMAGE_DIRECTORY_ENTRY_COM_DESCRIPTOR 0x000000000000 0x000000000000
IMAGE_DIRECTORY_ENTRY_RESERVED 0x000000000000 0x000000000000

Import Directory (Original):
Name Ord
-------------------------------------------------- -----

Export Directory:
Entry Stat Ord Name
-------------- ---- ----- --------------------------------------------------
0xf80002677794 M 0 ntoskrnl.exe!AlpcGetHeaderSize (nt!AlpcGetHeaderSize)
0xf80002677760 M 1 ntoskrnl.exe!AlpcGetMessageAttribute (nt!AlpcGetMessageAttribute)
0xf80002665eb0 M 2 ntoskrnl.exe!AlpcInitializeMessageAttribute (nt!AlpcInitializeMessageAttribute)
0xf800026b5ac0 M 3 ntoskrnl.exe!CcCanIWrite (nt!CcCanIWrite)
0xf8000262a244 M 4 ntoskrnl.exe!CcCoherencyFlushAndPurgeCache (nt!CcCoherencyFlushAndPurgeCache)
... (Truncated)
0xf80002b4d2ab M 2111 ntoskrnl.exe! (None)
Version Information:
key value
-------------------- -----

Now instead of disassembling to the interactive notebook, we store it in a file. This does take a while but will produce a large text file containing the complete disassembly of the windows kernel (With debugging symbols cross referenced).
In [3]:
disoffset=0xF8000261F000+0x1000,end=0xF8000261F000+0x525000,output="ntkrnl_amd64.dis"
Now we can use our favourite editor (Emacs) to check all references to MmGetPhysicalMemoryRanges. We can see references from:
  • nt!PfpMemoryRangesQuery - Part of ExpQuerySystemInformation.
  • nt!IoFillDumpHeader - Called from crashdump facility.
  • nt!IopGetPhysicalMemoryBlock - Called from crashdump facility.
We can also check references to MmPhysicalMemoryBlock. Many of these functions appear related to the Hot-Add memory functionality:
  • nt!IoSetDumpRange
  • nt!MiFindContiguousPages
  • nt!MmIdentifyPhysicalMemory
  • nt!MmReadProcessPageTables
  • nt!MiAllocateMostlyContiguous
  • nt!IoFillDumpHeader
  • nt!MiReleaseAllMemory
  • nt!MmDuplicateMemory
  • nt!MiRemovePhysicalMemory
  • nt!MmAddPhysicalMemory
  • nt!MmGetNumberOfPhysicalPages - This seems to be called from Hibernation code.
  • nt!MiScanPagefileSpace
  • nt!MmPerfSnapShotValidPhysicalMemory
  • nt!MmGetPhysicalMemoryRanges
Some testing remains to see how stable this modification is in practice. It appears that probably Hot Add memory will no longer work, and possibly hibernation will fail (Hibernation is an alternate way to capture memory images, as Rekall can also operate on hibernation files). Although the above suggests that crash dumps are affected, I have tried to produce a crashdump after this modification, but it still worked as expected (This is actually kind of interesting in itself).

PS

This note was written inside Rekall itself by using the IPython notebook interface.

OSX 10.9 Memory Acquisition

$
0
0
Late in 2012, the only free solution for Mac memory acquisition was MacMemoryReader, which is not open source and depends on a binary distribution of the driver to be built especially for the target kernel. This means MacMemoryReader actually carries 5 different versions of it's kernel extension in it's supportfiles directory, and automatically chooses the correct one as long as it is used on a system that was supported at the time the program got packaged.

These constraints didn't fit our use case very well, which is why I developed an open source memory acquisition program for Mac OSX called OSXPmem. This program was designed specifically with the goal to be as operating system independent as possible, while providing a stable way to acquire memory even on future versions of Mac OSX.

With the 10.9 release of OSX, MacMemoryReader stopped working (it only packages drivers for OSX 10.5 - 10.8). Fortunately, OSXPmem still works and is currently the only free memory acquisition tool which is able to acquire memory on Mac OSX 10.9 or higher.

In this blogpost I want to elaborate a bit on the reasons for that, while also giving an overview on how memory acquisition on Mac OSX actually works under the hood.

How Memory Acquisition is Implemented

Because of memory protection it is not possible for a normal user-mode application to just go ahead and read all the memory. Each process resides in a virtual address space which is mapped into physical memory using paging. The data-structures used for this are managed by the kernel, and can only be accessed from system-mode. This is the reason why any memory acquisition program must first load a driver into the kernel, that provides the actual memory access.

Enumerating Physical Memory

Physical memory is not continuous, so don't expect the physical address space of a computer with e.g. 4GB of RAM to be laid out as one chunk from 00000000 - FFFFFFFF. The physical address space itself is again a virtual construct, controlled by the northbridge. For faster access to device memory, many hardware devices like graphics or network cards map parts of their integrated memory or registers into the physical address space via memory mapped I/O. The BIOS (or on modern systems the EFI) initializes the hardware on boot and arranges all these memory chunks into something called the physical address space. Here is a redacted example of the layout on my laptop:

 Size of physical address space: 6171918336 bytes (206 segments)  
Memory Type Start Addr End Addr
Conventional 0000000000000000 000000000008f000
Reserved 000000000008f000 0000000000090000
Conventional 0000000000090000 00000000000a0000
Reserved 00000000000a0000 0000000000100000
...
Conventional 0000000100000000 000000016fe00000

Regions marked "Conventional" are guaranteed to be backed by physical memory, while regions marked "Reserved" might contain device memory. It should be avoided to read from the reserved regions, as this can trigger interrupts on a device and thus even result in a hardware malfunction, system instability and a kernel crash. If you're interested in more details I can recommend Gustavo Duarte's excellent articles Getting Physical With Memory and Motherboard Chipsets and the Memory Map.

The bottom line is that a memory acquisition tool must find out how physical memory is laid out in order to acquire it in a way that does not cause instability and thus loss of the desired data. This is usually done by querying the kernel, as it manages physical memory and has to know it's layout. On Mac OSX the EFI passes this information to the component of the kernel called the platform expert, which stores it in a data-structure in PE_state.bootArgs->MemoryMap. If you look at line 13 of PE_state_raw.dtrace in MacMemoryReader's supportfiles directory, you can see how it is obtained:

 self->kgm_boot_args = ((struct boot_args*)(`PE_state).bootArgs);  

OSXPmem uses the same source of information to obtain the memory map. Unfortunately this information is not very reliable, as this data-structure is not used by the kernel at runtime, making it an easy target for rootkit manipulation. In one of our papers last year we showed that it is trivial to overwrite this data-structure, making memory acquisition impossible on the system. We also implemented a more reliable way to obtain an accurate memory map in that publication. However, this has not been implemented for OSX yet.

Mapping Physical Memory

Because even the kernel operates inside virtual memory, the memory acquisition driver needs to map physical memory into the kernels address space. On OSX, this is ultimately done by the Mach portion of the kernel. However, kernel extensions are not allowed to link directly to kernel functions. Instead, they are linked to Kernel Programming Interfaces (KPI), which are interfaces to a limited set of symbols Apple allows kernel extensions to use. The functions available through these interfaces can change with every kernel release, especially the ones in the "unsupported" KPI (where the Platform Experts state is linked from). But even supported KPIs like the ones for physical memory mapping can change, as Apple has shown in the past.

Both OSXPmem and MacMemoryReader use a simple BSD kernel extension (kext) to provide memory access. However, physical memory mapping is only supported from Apples IOKit framework. This is the reason why both kext use the IOMemoryDescriptor class to map memory into the kernel. Now with the introduction of memory compression in OSX 10.9 this method has been found to cause problems. The kernel can compress and uncompress memory on the fly, and doesn't want any other driver touching it. It is entirely possible that in future OSX releases some KPIs will change and this method of mapping memory will not be possible at all.

Luckily, we have also developed a different mapping technique. Originally intended as a rootkit resilient mapping technique, this approach has also proven to be very reliable on any major operating system. It works by directly modifying the page tables and clearing the caches, forcing the memory management unit (MMU) to remap an existing virtual address. As illustrated in Figure 1, a virtual page called "Rogue Page" is remapped by editing the page table entry (PTE) directly and then flushing the translation lookaside buffer (TLB). This enables us to access any arbitrary page in the physical address space, without any kernel dependency. Details on this approach can be found in our paper.

Figure 1: PTE Remapping


By "bypassing" the kernel when accessing memory this technique does not depend on any KPIs and thus isn't affected by compressed RAM or any obstacles Apple might decide to put into the IOMemoryDescriptor in future versions of OSX. This is why we made it the default mapping method in WinPmem and OSXPmem. We expect this method to be more stable and resilient to changes in the kernel and even anti-forensic techniques.

Kernel Extention Code Signing

With the release of OSX 10.9 Apple has changed it's previous policy on driver signature enforcement. While it was previously possible to sign a kernel extension, unsigned kext could also be loaded without any issues. In 10.9 and later, the kext loader displays a warning message when an unsigned kext is loaded. It is very likely that Apple will adopt the Microsoft approach at some time, preventing unsigned kext to be loaded. This is why we also provide a signed binary for OSXPmem RC2 on the Rekall download page.

32-bit Kernel Support

OSXPmem only supports Macs using the 64-bit version of OSX. Apple introduced 64-bit builds with OSX 10.6, making it the default with 10.7. Since OSX 10.8, the 32-bit kernel is deprecated and all Macs running 10.8 or higher should be running in 64 bit mode. This means OSXPmem will not work on OSX 10.5 or older, and might not work on some 10.6 systems. I will not add 32-bit support, as these kernels are deprecated and only run on very old machines anyways. If you need to acquire memory from such a system I encourage you to use MacMemoryReader.

New Rekall Plugin: Mac Compressed Memory

$
0
0
Beginning of August I went to the DFRWS US conference in Denver. There were lots of very interesting talks on forensics presented at that conference but I found one of them particularly interesting. The title of the presented paper was "In Lieu of Swap: Analyzing Compressed RAM in Mac OS X and Linux" (Golden G. Richard III and Andrew Case) [1]. The conference organizers found this paper really good too, it won this years Best Paper Award.

In the talk, one of the authors presented how they are able to extract Mac compressed memory from an image. Since OS X Mavericks, Macs can compress memory regions that are not currently used to save some space [2]. This obviously poses some problems for memory forensics since for example simple string matching won't work anymore if the memory you are looking at was compressed.

In the presentation, one of the authors introduced their approach to find and decompress those memory regions (they implemented a Volatility plugin which does it). I became particularly interested when I heard that he was complaining that the Python implementation of the decompression algorithm they have is very slow. I really wanted to analyze what they have done and if there is a way of improving the speed of this algorithm but unfortunately I found out that the authors have not released the code for this yet. Even now, one month later, the code is nowhere to be found :( I thought this might be an
interesting challenge though so that same evening after coming back from conference beers I sat down and implemented my own version of the decompressor.

To compress memory, Apple uses an algorithm called WKdm which was published in 1997 by Paul Wilson and Scott F. Kaplan (with slight modifications). There is a standard C implementation freely available (for example found in this repository [3]) but no Python one as far as I know. Apple uses a highly optimized assembler version for Mavericks which is way faster than the C implementation.

I ported the code from [3] basically 1:1 to Python and quickly saw why the Python version is slow. There are lots of bit operations that Python is particularly bad at and also many of the operations are vectorized in C which is not so easily done in Python. I spent some time optimizing this using some precomputations and use of Python iterators as pointers and actually got acceptable performance for this algorithm. My implementation can now do 1000 compress/decompress operations of a 4k page per second on my 2014 Macbook Pro 15 inch which is 2.5 times as much as what was claimed in the talk for the implementation they had. Of course I am fully aware that I'm comparing apples and oranges here since the hardware they used was probably completely different. However, they still have not released the code they were talking about so I have no way of staging a fair comparison. Regardless of the performance difference, this was a fun exercise. If you want to take a look at my optimized implementation, it's available in the Rekall repository [4].

As a side effect of having this memory decompressor, I was also able to implement a Rekall plugin that dumps all compressed memory pages in a Darwin image to disk, it's called "dumpcompressedmemory":

rekal -f ~/mem.dump

<...>
mem.dump 14:03:46> mkdir /tmp/compressed_memory
mem.dump 14:03:54> dumpcompressedmemory(dump_dir="/tmp/compressed_memory/")
<...>

mem.dump 14:04:03> ls /tmp/compressed_memory/
segment0/ segment1/ segment10/
<...>

mem.dump 14:04:08> ls /tmp/compressed_memory/segment1
slot1.dmp slot16.dmp slot23.dmp slot29.dmp slot34.dmp slot43.dmp
slot10.dmp slot17.dmp slot24.dmp slot3.dmp slot35.dmp
<...>


[1] http://dfrws.org/2014/proceedings/DFRWS2014-1.pdf

[2] https://www.apple.com/osx/advanced-technologies/

[3] https://github.com/santolucito/CCache/tree/master/WKdm

[4] https://github.com/google/rekall/blob/master/rekall/plugins/darwin/WKdm.py

VM discovery and introspection with Rekall

$
0
0
Monday, 9 AM. Your SIEM alerts you of packets matching a Gh0stpdf signature coming from a web designer’s OS X machine. Network activity for the host shows HTTP requests with a Chrome on Windows user-agent. The machine has Virtualbox installed and running.
An hour later, another alert fires for a known-bad URL hit from one of your customers' Windows VMs on your OpenStack Compute/KVM deployment.
It looks like it’s gonna be a long week.
These are two scenarios that would most likely require disk forensics to triage and analyze since the VMs are out of your control and none of your remote forensics tools are installed. Lots of time wasted just to determine if they are false positives.
  • What if you could inspect the VM and launch your Rekall plugin of choice on it? With Rekall you can!
  • “I want to do it remotely, live!” Try GRR (now with Rekall integration) *wink*.
  • What if you prefer to use your tool of choice instead of Rekall to analyze the VM memory? Rekall helps you!
Rekall is the first memory framework to support transparent introspection of VMs with any host-guest OS combination and is independent of the virtualization software layer, as long as it’s employing Intel Virtualization extensions with Extended Page Tables which is present in all modern Intel processors and the default for many virtualization packages.
Together with GRR, Rekall allows you to discover virtual machines running in your fleet and analyze their memory, live requiring only access to the host. No interaction is done with the virtualization layer.
In this article I’ll explain how Intel’s hardware-assisted virtualization works, how Rekall emulates this technology to allow transparent introspection of guest VMs from just the host memory and the challenges of its implementation.
If you just want to know how detect and analyze VMs right away, see [the_vmscan_plugin]. For a complete feature list, see [feature_list].

Short introduction to virtualization

Virtualization has become a pervasive technology. From cloud infrastructure and malware analysis sandboxes, to consumer-grade virtualization products that allow you to run your Operating System of choice, virtualization is everywhere.
Virtualization at its core separates software from hardware in a way that allows multiple operating systems to share the same resources, at the same time. Some resources such as memory are split so that each virtual machine has access to a portion of it, while others like your network card are shared. It is a not a new concept and several different techniques have been used for a long time to provide such capabilities.
Virtualization can be done in multiple ways:
  • Full emulation (like in Bochs) allows for complete control over the running code at the expense of speed. Each and every CPU instruction of the guest OS is trapped and its effect on the state of the virtual machine is emulated.
  • Binary translation, on the other hand, takes blocks of instructions and translates them to a different set of instructions. Then they are executed natively in the processor. This technique can be used to apply optimizations, run code compiled for a CPU in a different CPU or to facilitate debugging by introducing traps in the code.
  • Paravirtualization, instead, requires the guest kernel to be modified so that it knows that it’s running virtualized and executes code accordingly. It usually provides better performance than either Full emulation or Binary translation but is only supported by some operating systems (i.e Linux-XEN).
  • Hardware-assisted. Where the CPU provides functionality to aid or speed up virtualization tasks such as running the guest code, quick page translations or device access control.
Because most operating systems base process isolation on paging and page-level protections, virtualization solutions must also virtualize paged memory. The main problem with this is that virtualizing paged memory adds noticeable overhead.
By 2004, AMD realized the need for hardware-assisted virtualization and announced their virtualization solution AMD-V (codenamed Pacifica). It wasn’t until May 2006 that they commercialized the first Athlon 64 processors with AMD-V support. To improve performance of page translations, AMD introduced a technology called RVI (Rapid Virtualization Indexing) in September 2007.
Intel also realized the problem and introduced VT-x (codename Vanderpool) in November 2005 along with processors that had support for it. However, it wasn’t until November 2008 that Intel introduced their response to AMD’s RVI, called EPT (Extended Page Tables) in their 2nd generation processors.
Both AMD-V and VT-x introduce support for running code for the VM directly on the CPU, while offering at least the same level of protection as native code. Both RVI and EPT attempt to solve or mitigate some of the page translation overhead by allowing the processor to perform all the page translations for the VM all the way up to the physical memory. Both hardware-assisted solutions are remarkably similar.
Nowadays, most virtualization solutions use hardware-assisted virtualization when available and resort to a mix of the aforementioned techniques when it’s unavailable. Some solutions implement a backdoor of sorts in the kernel that is allowed direct communication from the guest to the host (an example of which is VMWare Tools).
Rekall supports detection and transparent emulation of Intel VT-x with EPT translation since January 2014. We support any host and guest OS, both 32 and 64bits.
WarningBecause EPT translation was introduced after Penryn processors were released, Rekall can find VMs on Penryn processors but not inspect them at this time. Some Nehalem processors also didn’t have support for EPT translation. You can use http://ark.intel.com/products/virtualizationtechnology to check if the processor of the machine you’re trying to analyze has EPT support. Most machines bought in the last 5 years should be supported.

x86 hardware-assisted virtualization

The central piece of any virtualization technology is the hypervisor. This component sets up the virtual machine and controls its execution.
In x86 hardware-assisted virtualization the CPU is in charge of actually running the VM (that is, it executes its code), but the hypervisor code gets control every now and then. In VT-x you tell the CPU to pause the VM execution and return control to the hypervisor under certain circumstances.
posts/images/vtx_high_level.png
Figure 1. High-level view of processor CPL transitions with VT-x enabled.
In order to set up the VM and start/resume it, VM-specific x86 instructions are used (VMREADVMWRITEVMPTRLDVMRUN). Only code running with CPL 0 (ring0) is allowed to execute these instructions. This is why virtualization software use kernel drivers. These kernel components are the actual hypervisor and pretty much all virtualization products provide some sort of UI or API to communicate with the hypervisor and request operations like pausing or resuming a VM.
One key piece the hypervisor has to set up before asking the processor to run a VM is what Intel calls a Virtual Machine Control Structure (VMCS). This structure holds all the state of the VM and contains information such as:
  • The conditions under which the CPU should stop executing the VM and return to the hypervisor; this is stored in control fields.
  • State information about the guest VM. Values of important registers like CR0, CR3, EAX, EBX or EIP. These are needed to run or resume the VM.
  • State information about the hypervisor. To know how the processor can get back to executing it when one of these conditions happen.

VT-x: Virtualized memory and EPT translation

Let’s talk about virtual memory for a second. When using paged memory any memory references require performing a virtual to physical page translation. This means taking the address that was requested and finding the location in memory where data is actually stored. This process requires traversing page tables and this usually requires 3 to 4 memory lookups. The processor has a cache called the Translation Lookaside Buffer (TLB) whose job is to improve these lookups.
posts/images/real_address_translation.png
Figure 2. High-level view of address translation in a real machine.
One of the main premises behind full virtualization is that software should run as is and in an environment virtually indistinguishable from a real machine.
This means that a software-based full virtualization solution must emulate paging when the operating system it runs requests it. And, at the same time, a full-virtualization solution must separate the memory of two running VMs from each other. The way this is solved is by having two page tables.
  • One that maps a VM’s physical memory. These page tables translate addresses of the VM’s "physical memory" to the actual physical memory of the host.
  • One that maps the guest operating system virtual to physical translation.
This means that a software-only full-virtualization solution has to perform at least 2 sets of traversals of page tables before resolving an address. This requires a lot of memory accesses for each resolution because it has to traverse the physical-to-physical set of page tables on every step of the virtual-to-physical resolution.
This is the fundamental problem that Extended Page Tables (EPT) tries to optimize. The processor is in charge of maintaining and optimizing both page mappings. The guest-physical-to-host-physical page tables are pointed to by the EPT Pointer (EPTP), which is a value stored in the VMCS region. The guest-virtual-to-guest-physical page tables are pointed to by the GUEST_CR3 field of the VMCS region.
posts/images/virtualized_address_translation.png
Figure 3. Address translation in a virtual machine. Rekall emulates the CR3 and EPT page translation step.

VM introspection

Rekall requires having access to the physical memory of a machine to perform its magic of OS and memory layout autodetection.
We just explained that the Extended Page Tables perform a mapping between guest physical and host physical memory, so the only thing we need to do is find them. This means finding the value of the EPT pointer, which resides in the VMCS.
There’s two caveats, though.
  • A VMCS region can be anywhere in memory and no preset locations or registers hold references to it.
  • Most of the layout of the VMCS region is an implementation detail and is undocumented.
Let’s try to solve the first problem: finding VMCSs in memory.

Detecting a running VM: Discovering VMCS regions in memory

Since we don’t have pointers to the VMCS regions that may be in memory, we’ll have to try creating signatures.
From the Intel manual we know that the region has the following properties:
  • It’s stored in a 4KB page.
  • The first 4-bytes have to match the processor revision ID.
  • The 4 following bytes are the VMX-abort indicator. This field will be 0 unless an error occurred.
  • The rest is reserved for VMCS fields and is an implementation detail.
posts/images/vmcs_layout.png
Figure 4. The VMCS layout as described by Intel.
With just this information we already have a signature. The problem is that this is a very weak signature and would give thousands of hits on any memory image. We need a way to refine it. And this means we need to find fields in the VMCS whose values we can rely on or that we can validate.
Mariano Graziano, Andrea Lanzi and Davide Balzarotti [madhmf] did a great study of this issue and identified fields in a VMCS that are essential to it running. They found that several of the fields have fixed values and that changing them at runtime would make the VM to stop functioning. We could extend our signature to include them, except that we don’t know yet where in the VMCS region these fields are.
Time to solve the second problem.
TipMariano Graziano also released a proof of concept implementation of his research onhttp://www.s3.eurecom.fr/tools/actaeon/, with support for 32-bit Windows guests and 3 microarchitectures (Penryn, Nehalem and Sandy Bridge).

Detecting a running VM: Mapping the layout of the VMCS region

So we don’t know what the layout of the VMCS region is but we have control over it:
  • We can decide its initial state
  • We can ask the processor to read (VMREAD) and write to it (VMWRITE).
  • We can see the effect each operation has on the 4KB page.
Graziano et al [madhmf] devised the following method:
  1. Start with a blank (zero’d out) memory region.
  2. Instruct the CPU to use this region.
  3. VMWRITE to a single field with a needle value.
  4. Find the needle in the memory region and record its offset.
  5. Repeat this step for every field.
This works, except there’s some fields in the VMCS that are read-only. For example, fields used for error-reporting that you cannot write to.
So they devised a second method. Not all fields are writable but all of them are readable. Instead:
  1. Prefill the memory region with values that represent the offset within the region a value is located.
  2. Instruct the CPU to use this region.
  3. VMREAD a single field.
  4. The value should contain its own offset within the region.
  5. Repeat for every field.
posts/images/vmcs_layout_discovery.png
Figure 5. The VMCS layout discovery process.
This approach mostly works but there’s some caveats.
  • It assumes all fields are aligned to a 2 or 4 byte boundary. This appears to be the case.
  • Some fields don’t become active unless a relevant flag is active in other fields.
  • VMREAD behaviour for inactive fields isn’t consistent, sometimes properly reporting a failure, sometimes returning bogus data.
But suffice to say this technique discovers almost all of the fields, and certainly the relevant ones for our goals.
One important discovery they did is that the layout changes only between microarchitectures. This means all Nehalem processors share the same layout, which is different from Westmere’s layout. So, in theory, we only need as many signatures as microarchitectures support VT-x.
NoteWe’ve seen that Ivy Bridge and Sandy Bridge actually share the same layout despite officially being two different microarchitectures. They even have the same revision ID.
Luckily for us, the revision ID field in the VMCS region can be used to identify the microarchitecture, so we can select the right offsets when we start validating potential VMCS hits with intelligent signatures.
To automate the layout discovery task in a convenient way I wrote a Linux kernel module called vmcs_layout that dumps via syslog the VMCS layout of the CPU in the profile format of Rekall.
Currently, Rekall has in its repository profiles for all current Intel microarchitectures that support virtualization: Penryn, Nehalem, Westmere, Sandybridge, Ivy Bridge and Haswell.

Haswell is interesting

While working on vmcs_layout, I found that this exact approach doesn’t work on processors with the Haswell microarchitecture. No matter how many VMWRITEs you do, you won’t see the value you wrote in memory right away. Same thing for VMREAD. If you prefill the page, ask the processor to use that page as a VMCS region and then issue a VMREAD you will get zeros back. Why?
Well, the the Intel manual explicitly says:
A logical processor may maintain a number of VMCSs that are active. The processor may optimize VMX operation by maintaining the state of an active VMCS in memory, on the processor, or both. At any given time, at most one of the active VMCSs is the current VMCS.
As far as I’ve seen, Haswell processors are the first ones to implement internal storage for VMCSs. So, in order to discover the layout, I implemented a simple trick in vmcs_layout.
vmcs_layout asks the processor to keep loading fake VMCSs until we overflow its storage. Then the processor is forced to flush to memory one of the previous VMCSs to make space for a new one. When this happens, any new VMCS that we ask the processor to load will forcefully be read from memory because it doesn’t know about it and cannot know if it holds previous state unless it reads it from memory. So we then proceed as explained earlier. We prefill it with values and discover the fields as usual.
Does this mean we may not find Haswell VMCS regions in memory? In my tests, I’ve been able to locate them in memory just fine. It’s likely when running VMRUN to start a VM or when transitioning back to the hypervisor, the processor flushes it to memory. I haven’t determined what exactly causes this to happen. Please, let us know if you find problems like virtual machines not being detected or being detected with the wrong number of cores.

Detecting a running VM: One last thing

Once we know how to identify candidate VMCS regions in memory and we build an intelligent scanner that checks for known values of different fields and the right offsets based on the microarchitecture of the VMCS region, we are a step closer to actually finding real, valid VMCS.
What are we missing, then? Well, we may still have false positives. Or we may have imaged a host shortly after a VM has been stopped or paused and the VMCS may be in memory but the physical memory of the VM freed and reused. We need some additional validation.
When the processor stops executing a VM and wants to returns its execution to the hypervisor it has to restore the whole processor state. This not only means registers like EAX and ECX, but the paging configuration as well (page table location and mode: IA32, PAE or AMD64). This state is stored in the VMCS region as well.
In order to further validate a candidate region we resort to traversing the page tables of the host as stated by the VMCS and we try to see if the VMCS region itself is mapped in it. This is because the hypervisor must have it mapped in its address space, or else it wouldn’t be able to control execution of the VM.
This step also makes sure that the host address space is well-formed. If it’s a false positive, it’s unlikely it will point to data that can be interpreted as a page table. So this check actually has an acceptable performance for false positives.
At this point, we know we have a valid VMCS and we are now ready to use the EPT pointer to access the guest physical memory. This means we can now have access to the VM’s physical memory in a generic way!
All this scanning and validating is done by the vmscan plugin. See an example invocation for a host with 3 VMs running on 2 different hypervisors:
$ python rekall/rekal.py -f ~/memory_images/Windows7_VMware(VM,VM)_VBox(VM).ram vmscan
Virtual machines Type Valid EPT
------------------------------------ -------------------- -------- ---
VM #0 [2 vCORE, I386] VM True 0xDEB1B01E
**************************************************
VM #1 [2 vCORE, AMD64] VM True 0x14128D01E
**************************************************
VM #2 [4 vCORE, AMD64] VM True 0x17725001E
**************************************************

Introspecting a running VM

Once you know the EPT value you can feed it to Rekall with the --ept parameter.
What this does is place VTxPagedMemory address space as the session.physical_address_spaceVTxPagedMemory stacks on top of the memory image address space (the one that can read from the file format of the memory image). Any read requests done on VTxPagedMemory for a given address will first translate the address via the Extended Page Tables and then read from the underlying address space at the translated address.
So, normally, if you’re running a plugin against a raw memory image, when it requests to read data at the physical address 0, we’ll read at offset 0 from the file.
However, when you specify --ept, VTxPagedMemory will instead receive this request, translate address 0 via EPT (for example: 38684000) and return data from the underlying address space.
Because of how address spaces are designed, neither rekall or the plugins care that they are not actually reading from the physical image, but from a view into it (the VM memory).
  • Kernel autodetection, for example, reads from the physical address space and finds and sets the session.kernel_address_space for it. When using the --ept parameter, it will locate the guest kernel instead.
  • Plugins will operate on the guest automatically because they don’t even know they’re not seeing the host memory.
posts/images/vtxpagedmemory.png
Figure 6. Address space stacking and how VTxPagedMemory is transparent to any plugin.
TipYou can read more about address spaces here.

Multi-core VMs

Up to this point we know how to properly find and validate VMCS regions in memory. One more thing I must explain to understand Rekall’s output is what happens with multi-core VMs.
In VT-x a VMCS region is only used by 1 core at a time. This means that you can run more than one VM at a time and that you can provide a VM with more than one core. Nowadays, actually, most processors are multi-core and most virtualization software can take advantage of this. Which means we’ll often find VMs with more than one core.
What this means for us is that if we have a VM running with 4 "virtual cores", we will find 4 valid VMCS in memory. They will all most likely point to the same set of Extended Page Tables, as they represent the physical memory and the same holds true in real machines (1 physical memory, N cores).
We wanted Rekall to provide a VM-oriented interface, so as you may have noticed we group them together in the output giving you the number of VMCS detected as the number of vCOREs of the VM.

Nested virtualization

Rekall also supports a limited subset of nested virtualization (KVM, VMWare) setups but we’ll leave this for another post.

The vmscan plugin

Use the vmscan plugin, which will find all VMCS regions in memory and group them together logically as virtual machines.
In this test image, the host is Windows 7 SP1 x64. It’s running 2 VMs inside VMWare (Linux and Windows XP SP2 32bits) and 1 Windows 7 x64 VM inside VirtualBox.
$ python rekall/rekal.py -f ~/memory_images/Windows7_VMware(VM+VM,VM)_VBox(VM).ram vmscan
Virtual machines Type Valid EPT
------------------------------------ -------------------- -------- ---
VM #0 [2 vCORE, I386] VM True 0xDEB1B01E 1
**************************************************
VM #1 [2 vCORE, AMD64] VM True 0x14128D01E 2
**************************************************
VM #2 [4 vCORE, AMD64] VM True 0x17725001E 3
**************************************************
1Windows XP SP2 32bits running on VirtualBox.
2Windows 7 X64 running on VMWare.
364-bit Linux VM running on VMWare.
Now you can run plugins on any VM by using the --ept parameter on the command line.

How to run a rekall plugin on a VM

To run a rekall plugin on a VM that vmscan found, invoke rekall as you normally would, but add --ept EPT_VALUE as a parameter.
We’ll run pslist on the XP SP3 32bit VM first.
$ python rekall/rekal.py -f ~/memory_images/Windows7_VMware(VM+VM,VM)_VBox(VM).ram --ept 0xDEB1B01E pslist
Offset (V) Name PID PPID Thds Hnds Sess Wow64 Start Exit
---------- -------------------- ------ ------ ------ -------- ------ ------ ------------------------ ------------------------
0x823c6a00 System 4 0 54 241 ------ False - -
0x82018598 wuauclt.exe 380 1000 3 106 0 False 2014-03-04 15:58:48+0000 -
0x821f1020 smss.exe 508 4 3 19 ------ False 2014-03-04 15:56:32+0000 -
0x82199da0 csrss.exe 572 508 11 298 0 False 2014-03-04 15:56:33+0000 -
0x821a3020 winlogon.exe 596 508 19 513 0 False 2014-03-04 15:56:33+0000 -
0x8219c6d0 services.exe 640 596 15 243 0 False 2014-03-04 15:56:33+0000 -
0x8225d4c0 lsass.exe 652 596 18 336 0 False 2014-03-04 15:56:33+0000 -
0x8222b020 svchost.exe 832 640 16 191 0 False 2014-03-04 15:56:34+0000 -
0x82212c20 alg.exe 864 640 6 107 0 False 2014-03-04 15:56:50+0000 -
0x8218e020 svchost.exe 900 640 8 238 0 False 2014-03-04 15:56:34+0000 -
0x82222748 wscntfy.exe 968 1000 1 26 0 False 2014-03-04 15:56:50+0000 -
0x821a73c8 svchost.exe 1000 640 56 1435 0 False 2014-03-04 15:56:34+0000 -
0x820a5020 svchost.exe 1092 640 4 76 0 False 2014-03-04 15:56:34+0000 -
0x821afda0 svchost.exe 1196 640 13 192 0 False 2014-03-04 15:56:34+0000 -
0x82094020 spoolsv.exe 1344 640 10 107 0 False 2014-03-04 15:56:35+0000 -
0x81f13bc0 cmd.exe 1376 1600 1 30 0 False 2014-03-04 17:14:24+0000 -
0x8206b020 explorer.exe 1600 1544 11 302 0 False 2014-03-04 15:56:36+0000 -
And now we’ll try doing a pslist on the 64-bit Ubuntu.
$ python rekall/rekal.py -f ~/memory_images/Windows7_VMware(VM+VM,VM)_VBox(VM).ram --ept 0x14128D01E,0x3D67F01E pslist
Offset (V) Name PID PPID UID GID DTB Start Time
-------------- -------------------- ------ ------ ------ ------ -------------- ------------------------
...
0x88003b8d1770 dbus-daemon 966 - 102 106 0x00003c244000 -
0x88003c6bc650 systemd-logind 1031 - 0 0 0x00003c18a000 -
0x880036978000 getty 1042 - - - 0x000039b9d000 -
0x88003697aee0 getty 1049 - - - - -
0x880036bcddc0 getty 1055 - 0 0 - -
0x88003c310000 getty 1056 - - - 0x00003c7af000 -
0x88003b629770 getty 1058 - - - 0x00003c6b6000 -
0x88003b82aee0 sshd 1074 - - - 0x00003c1b9000 -
0x880039954650 acpid 1081 - - - - -
0x880035cd1770 irqbalance 1103 - 0 0 0x000035d64000 -
0x880036869770 cron 1131 - 0 0 0x00003c246000 -
0x8800369baee0 atd 1132 - - - 0x00003693d000 -
0x88003b9f4650 login 1160 - 0 1000 0x00003caf2000 -
0x88003c311770 whoopsie 1176 - - - - -
0x88003b8b8000 libvirtd 1199 - 0 0 0x00003c0a4000 -
0x88003686c650 kauditd 1290 2 0 0 - -
0x88003b30ddc0 bash 1335 1160 - - 0x00003b60d000 -
0x88003b8bc650 dnsmasq 1486 - 108 30 - -
...

Live analysis

All of this works live, too!
Open a root/administrator console and use any of our physical memory access drivers. Then try pointing rekall against "\\.\pmem" on Windows or "/dev/pmem" on Linux while running a VM and Rekall will detect it for you. Remember that you need to have VT-x extensions active (it’s usually a BIOS setting).
C:\winpmem-1.4> winpmem_1.4.exe -l
Driver Unloaded.
Loaded Driver C:\Users\Administrator\AppData\Local\Temp\pmeF23H.tmp.
Setting acquisition mode to 3
CR3: 0x0000185000
3 memory ranges:
Start 0x00001000 - Length 0x0009E000
Start 0x00100000 - Length 0x3FDF0000
Start 0x3FF00000 - Length 0x00100000

C:\winpmem-1.4> rekal -f \\.\pmem vmscan

Remote live analysis with GRR

Because GRR now ships with Rekall, you can remotely discover VMs running in a machine. Or your whole fleet if you run a Hunt!
Set up an AnalyzeClientMemory flow and use vmscan as the plugin name and select profile = None in the session data.
posts/images/grr_vmscan.png
Figure 7. Setting up a Rekall memory analysis flow in GRR.
Once you get the results, you can run additional plugins against a VM by adding the ept = 0xVALUE_FOUND as a parameter.
WarningAt this time, we don’t support running hunts for rekall plugins against the host and all VMs found in any machine. Only against the host. We want to extend this functionality in the future so that it can be automated.

The Rekall shell and VMs

You can also interact with VMs from the shell via the get_vms() method of the vmscan plugin. It returns a list of VirtualMachine:
$ python rekall/rekal.py -f ~/memory_images/Windows7_VMware(VM+VM,VM)_VBox(VM).ram
----------------------------------------------------------------------------
The Rekall Memory Forensic framework 1.0rc11.

"We can remember it for you wholesale!"

This program is free software; you can redistribute it and/or modify it under
the terms of the GNU General Public License.


Type 'help' to get started.
----------------------------------------------------------------------------
Windows7_VMware(VM+VM,VM)_VBox(VM).ram 00:03:28> vmscan_plugin = session.plugins.vmscan(session=session)
Windows7_VMware(VM+VM,VM)_VBox(VM).ram 00:04:17> vms = vmscan_plugin.get_vms()
Windows7_VMware(VM+VM,VM)_VBox(VM).ram 00:05:18> for vm in vms: print vm
VirtualMachine(Hypervisor=0XFFFFF8800E8718A0, EPT=0XDEB1B01E)
VirtualMachine(Hypervisor=0XFFFFFFFFFC2AE0FA, EPT=0X14128D01E)
VirtualMachine(Hypervisor=0XFFFFFFFFFC2AE0FA, EPT=0X17725001E)
VirtualMachine(Hypervisor=0X0, EPT=0X329D8F8)
Caution
VMs returned via get_vms() are all that were found, not just the valid ones. Use the is_valid property to check if a VM was determined to be valid. Invalid VMs are reported via the API to aid in debugging.
> vmscan_plugin = session.plugins.vmscan()
> vms = list(vmscan_plugin.get_vms())
> vms[0].is_valid
True
> vms[1].is_valid
False
You can run any plugin on a VM by using the RunPlugin() method of VirtualMachine.
Windows7_VMware(VM+VM,VM)_VBox(VM).ram 00:06:41> vms[0].RunPlugin("pslist")
Offset (V) Name PID PPID Thds Hnds Sess Wow64 Start Exit
---------- -------------------- ------ ------ ------ -------- ------ ------ ------------------------ ------------------------
0x823c6a00 System 4 0 54 241 ------ False - -
0x82018598 wuauclt.exe 380 1000 3 106 0 False 2014-03-04 15:58:48+0000 -
0x821f1020 smss.exe 508 4 3 19 ------ False 2014-03-04 15:56:32+0000 -
0x82199da0 csrss.exe 572 508 11 298 0 False 2014-03-04 15:56:33+0000 -
0x821a3020 winlogon.exe 596 508 19 513 0 False 2014-03-04 15:56:33+0000 -
0x8219c6d0 services.exe 640 596 15 243 0 False 2014-03-04 15:56:33+0000 -
0x8225d4c0 lsass.exe 652 596 18 336 0 False 2014-03-04 15:56:33+0000 -
0x8222b020 svchost.exe 832 640 16 191 0 False 2014-03-04 15:56:34+0000 -
0x82212c20 alg.exe 864 640 6 107 0 False 2014-03-04 15:56:50+0000 -
0x8218e020 svchost.exe 900 640 8 238 0 False 2014-03-04 15:56:34+0000 -
0x82222748 wscntfy.exe 968 1000 1 26 0 False 2014-03-04 15:56:50+0000 -
0x821a73c8 svchost.exe 1000 640 56 1435 0 False 2014-03-04 15:56:34+0000 -
0x820a5020 svchost.exe 1092 640 4 76 0 False 2014-03-04 15:56:34+0000 -
0x821afda0 svchost.exe 1196 640 13 192 0 False 2014-03-04 15:56:34+0000 -
0x82094020 spoolsv.exe 1344 640 10 107 0 False 2014-03-04 15:56:35+0000 -
0x81f13bc0 cmd.exe 1376 1600 1 30 0 False 2014-03-04 17:14:24+0000 -
0x8206b020 explorer.exe 1600 1544 11 302 0 False 2014-03-04 15:56:36+0000 -
Out<4> <rekall.plugins.windows.taskmods.WinPsList at 0x40ffa50>

Use other tools: Export raw memory of a VM

If you’d like to analyze a virtual machine in another tool that doesn’t support VM introspection, you can export the VM memory instead as a raw image!
Again, using the EPT parameter of the VM you want to analyze, simply run
python rekall/rekal.py -f ${HOST_IMAGE} --ept ${EPT_VALUE} imagecopy -O guest_vm.raw
And guest_vm.raw will contain the physical memory in raw format. Now you can load this image in your tool of choice :)

Rekall virtualization feature list

Supported
  • VM detection on any virtualization platform that uses Intel VT-x with EPT (requires access to the host physical memory).
    • All Type 2 (hosted) hypervisors (VMWare Workstation/Server, Virtualbox, KVM, QEMU-KVM, Parallels…).
  • Generic approach to VM introspection.
    • Any guest OS, 32 and 64 bits.
  • All current Intel microarchitectures
  • Live introspection on Windows, Linux and OS X hosts via the PMEM memory acquisition drivers.
  • Remote live VM detection and introspection with GRR.
  • Allows 3rd party tools to analyze the VM memory.
Planned
  • AMD-V support.
  • [Pending testing] Detection and introspection of VMs created from Type 1 (bare-metal) hypervisors provided a full physical memory capture has been acquired.
Unsupported
  • Live introspection on bare-metal hypervisors without direct physical memory access (VMWare ESXi, vSphere, Hyper-V(?), etc.)

Future improvements

We want vmscan to provide better output. In particular, we’d also like to provide the OS or profile that matches a VM and the hostname.
We’d also like to implement support for AMD-V so that people running AMD processors can benefit from VM inspection in Rekall.
We’re thinking of something along these lines.
$ python rekall/rekal.py -f ~/memory_images/Windows7_VMware(VM+VM,VM)_VBox(VM).ram vmscan2
Virtual machines Type/OS Valid Hostname EPT
------------------------------------ -------------------- -------- ------------------- ----------
Hypervisor #0: 0xFC78230 VMWARE True
VM #0 [2 vCORE, I386] Ubuntu 13.10 True localhost.local 0xDEB1B01E
VM #1 [2 vCORE, AMD64] Windows 6.0.6000 True VM-TEST-PC 0x14128D01E
Hypervisor #0: 0x6789090 VMWARE True
VM #0 [2 vCORE, I386+PAE] Linux 3.8-12-owl True openwall 0x14128D01E,0x3D67F01E
**************************************************
Hypervisor #1: 0x2345678 VIRTUALBOX
VM #2 [4 vCORE, AMD64] Windows 5.1.2600 True VBOX-VM 0x17725001E
**************************************************
Additionally, we’d like to better integrate all this functionality into GRR so you can discover and introspect VMs running in your environment with a couple of clicks.
If you have any other suggestions, make sure to let us know.

References

  • [madhmf] Mariano Graziano, Andrea Lanzi, Davide Balzarotti. Hypervisor Memory Forensics. 16th International Symposium on Research in Attacks, Intrusions and Defenses (RAID), St. Lucia, October 2013

Windows Virtual Address Translation and the Pagefile.

$
0
0

Rekall now has OS X 10.10 Yosemite support!

$
0
0
Last night, I pushed a changelist that officially adds support for analysing OS X 10.10 (Yosemite) to Rekall. The profile for Yosemite is now available, and OSXPMem supports full memory acquisition and live analysis. You can install the latest pre-release version of Rekall from our github page.

Please let us know if you find any bugs!

The Windows User mode heap and the DNS resolver cache.

$
0
0
Some applications contain a wealth of forensically relevant information, such as recent URLs visited, encryption keys etc. Analyzing applications, however, is difficult because most of the time these are not documented, and debugging symbols are not available or incomplete.
Virtually all applications use the heap to allocate memory (e.g. using malloc()/free()). Typically applications request the exact size they need from the heap allocator to accommodate the intended purpose of the memory. By enumerating all heap allocations we can sometimes get a good idea of their purpose. Unlike scanning techniques, heap enumeration allows us to see the memory layouts of structs at the application intends (i.e. we know where the structs begins in memory and how large it is).
This blog post explains Rekall’s new heap inspection plugin. In particular I wanted to demonstrate how heap inspection can be used to help reverse engineer some important application, such as the DNS resolver. In windows, DNS requests are typically cached by the DNS resolver service (which is running inside one of the svchost.exe processes). This information is very important from an incident response perspective since it can reveal recently accesses command and control (C&C) connections. However, the DNS resolver is a largely undocumented application, making it an excellent demonstration for heap based analysis.

1. What is a heap?

The kernel provides a single mechanism for an application to allocate memory - VirtualAlloc. By calling VirtualAlloc, the process is able to map new pages into its address space. The kernel will set up additional VAD regions and manipulate page tables to ensure this new region may be mapped by physical memory so that the application can use the memory as it pleases.
However, in practice, most applications do not need to allocate page sized memory (4kb), rather they need to rapidly allocate and free small allocations (e.g. 20 bytes) to store structs, strings etc. VirtualAlloc is kind of a sledgehammer - its quite slow since it needs to set up page tables, flush TLB etc.
Therefore the application uses a heap library. The library is a set of routines in the user process which divides up the large page-sized allocation the kernel can provide into manageable, small allocations the application needs. From the kernel’s point of view, the heap area is a contiguous region of process pages (marked with a VAD). But from the application’s point of view the heap represents a set of arbitrarily sized allocations (obtained via e.g. malloc()).
In the following discussion I examine how the heap looks like in a real process. In order to test this I wrote a quick c program which uses malloc() to allocate known strings:
#include"Windows.h"

int_tmain(int argc, _TCHAR* argv[])
{
int i;
char pattern[]=(
""// First byte for the size of allocation.
"The quick brown fox jumped over the lazy dog!"
"The quick brown fox jumped over the lazy dog!");

for(i=0; i<255; i++){
char*buff =(char*)malloc(i+1);
memcpy(buff, pattern, i);
buff[0]= i;// Mark the size of allocation in the first byte.

if((i %3)==0){
free(buff);
};
};

Sleep(100000);
return0;
}
This program simply allocates a string of increasing length and marks the length of the string in the first byte. The program also frees every third string. Finally the program simply sleeps, allowing us to either examine the live system memory, or acquire a memory image capturing the process memory. I just ran the ewfacquire plugin to write an EWF format image called output.E01 from within the Rekall interactive shell.
Note
When compiling the test program one should select the Release mode rather than the Debug mode. Compiling in Debug mode creates different heap structures which are larger and contain a lot of debugging information. It might be useful for Rekall to also support debugging heaps but currently we only support release heaps.

2. The windows HEAP implementation.

Implementing an efficient heap is actually a very complex task, since it needs to be very fast, use memory efficiently, and reduce memory fragmentation. Additionally heaps need to defend themselves from exploitation by being resilient to heap overflows. The Microsoft default heap implementation is implemented in ntdll.dll and is therefore available by default in all processes. Although it is possible for an application to use a different heap implementation, this is rarely done - most applications use the standard heap library.
The Microsoft heap has been studied extensively by the security community. The seminal references are:
These documents are very detailed and cover the heap operation algorithms with a general focus on exploitation. For our purposes, the information is too detailed, since we are only interested in enumerating all heap allocations and care less about how the heap actually works. I will therefore explain at a high level how the heap looks in memory and skip all the gory details of how the heap actually works.
The Microsoft heap implementation is divided into two parts - the Front End Allocator and the Back End Allocator. The Back End allocator is the one which actually requests memory from the kernel, managing relatively large blocks of memory. The Front End allocator is a fine grained allocator which further divides large memory regions (obtained from the backend allocator) into efficiently managed small allocations. In Windows 7 there is only one type of front end allocator named the Low Fragmentation Heap (LFH).
Another important point to make is that a single process may have multiple heaps for different purposes. This helps to keep related data together. We can see all the heaps that a process contains by examining the _EPROCESS.Peb.ProcessHeaps array in the Rekall interactive shell:
[1] output.E01 09:37:11> pslist proc_regex="heap"
_EPROCESS Name PID PPID Thds Hnds Sess Wow64 Start Exit
-------------- -------------------- ----- ------ ------ -------- ------ ------ ------------------------ ------------------------
0xfa8002c04060 heap.exe 2628 2956 1 7 1 False 2014-12-16 10:25:29+0000 -
[1] output.E01 09:47:37> task = session.profile._EPROCESS(0xfa8002c04060)
[1] output.E01 09:48:06> for heap in task.Peb.ProcessHeaps: print repr(heap)
<_HEAP Pointer to [0x00060000] (ProcessHeaps[0] )>
<_HEAP Pointer to [0x00010000] (ProcessHeaps[1] )>
<_HEAP Pointer to [0x00020000] (ProcessHeaps[2] )>
<_HEAP Pointer to [0x003C0000] (ProcessHeaps[3] )>
So there are 4 process heaps in this process. Note that each of these heaps exists in a VAD region:
[1] output.E01 09:51:48> vad pid=2628
**************************************************
Pid: 2628 heap.exe
VAD lev Start Addr End Addr com ------- ------ Protect Filename
-------------- --- -------------- -------------- ---- -------------------- --------
0xfa8002eec850 1 0x000000210000 0x00000030ffff 5 Private READWRITE
0xfa8001e30ed0 2 0x000000050000 0x000000050fff 1 Private READWRITE
0xfa8000df2ba0 3 0x000000030000 0x000000033fff 0 Mapped READONLY
0xfa8001754a10 4 0x000000010000 0x00000001ffff 0 Mapped READWRITE <----- Heap
0xfa8001c0e480 5 0x000000020000 0x00000002ffff 0 Mapped READWRITE <----- Heap
0xfa8000e83230 4 0x000000040000 0x000000040fff 0 Mapped READONLY
0xfa80010d7c00 3 0x000000060000 0x00000015ffff 25 Private READWRITE <----- Heap
0xfa8002acd1b0 4 0x000000160000 0x0000001c6fff 0 Mapped READONLY \Windows\System32\locale.nls
0xfa8000e12990 2 0x00007ffe0000 0x00007ffeffff -1 Private READONLY
0xfa8002ec2ad0 3 0x000076fc0000 0x000077168fff 12 Mapped Exe EXECUTE_WRITECOPY \Windows\System32\ntdll.dll
0xfa8001645580 4 0x00006da20000 0x00006daf1fff 10 Mapped Exe EXECUTE_WRITECOPY \Windows\System32\msvcr100.dll
0xfa8000df4e60 5 0x0000003c0000 0x0000003cffff 16 Private READWRITE <----- Heap
0xfa8002e460d0 6 0x0000003d0000 0x0000004cffff 17 Private READWRITE
0xfa8001bbc680 5 0x000076ea0000 0x000076fbefff 4 Mapped Exe EXECUTE_WRITECOPY \Windows\System32\kernel32.dll
0xfa8001737160 4 0x00007f0e0000 0x00007ffdffff 0 Private READONLY
0xfa8001dee1b0 5 0x00007efe0000 0x00007f0dffff 0 Mapped READONLY
0xfa8002ec2d60 3 0x07fffffb0000 0x07fffffd2fff 0 Mapped READONLY
0xfa80010d06d0 4 0x07fefcdf0000 0x07fefce5bfff 3 Mapped Exe EXECUTE_WRITECOPY \Windows\System32\KernelBase.dll
0xfa8002e1f8d0 5 0x00013f350000 0x00013f356fff 2 Mapped Exe EXECUTE_WRITECOPY \Users\mic\Documents\Visual Studio 2010\Projects\heap\x64\Release\heap.exe
0xfa8000e39010 5 0x07feff2e0000 0x07feff2e0fff 0 Mapped Exe EXECUTE_WRITECOPY \Windows\System32\apisetschema.dll
0xfa80011eb200 4 0x07fffffdd000 0x07fffffddfff 1 Private READWRITE
0xfa800148da10 5 0x07fffffde000 0x07fffffdffff 2 Private READWRITE

2.1. The Back End allocator.

The Back End allocator uses VirtualAlloc system calls to carve out large regions of contiguous memory. The memory is divided into regions called Segments. Each segment has a_HEAP_SEGMENT struct at its start. Segments form a linked list headed at the _HEAP.SegmentListEntry (Note that _HEAP is also a _HEAP_SEGMENT and therefore the first segment is the _HEAPstruct itself).
[1] output.E01 10:02:20> for seg in heap.SegmentListEntry.list_of_type("_HEAP_SEGMENT", "SegmentListEntry"):
|..> print repr(seg)
[_HEAP_SEGMENT _HEAP_SEGMENT] @ 0x003D0000
[_HEAP_SEGMENT _HEAP_SEGMENT] @ 0x003C0110
The Back End allocator further subdivides the Segments into smaller allocations to service user (and Front End) requests. Each of these user allocations is preceded with a _HEAP_ENTRY struct. On 64 bits Windows 7 this is:
[1] output.E01 10:10:07> dt "_HEAP_ENTRY"
[_HEAP_ENTRY _HEAP_ENTRY] @ 0x000000
Offset Field Content
-------------------- ------------------------------ -------
0x0 PreviousBlockPrivateData <Void Pointer to [0x00000000] (PreviousBlockPrivateData)>
0x0 Reserved <Void Pointer to [0x00000000] (Reserved)>
0x0 ReservedForAlignment <Void Pointer to [0x00000000] (ReservedForAlignment)>
0x8 AgregateCode [unsigned long long:AgregateCode]: 0x00000000
0x8 Code1 [unsigned long:Code1]: 0x00000000
0x8 CompactHeader [unsigned long long:CompactHeader]: 0x00000000
0x8 FunctionIndex [unsigned short:FunctionIndex]: 0x00000000
0x8 InterceptorValue [unsigned long:InterceptorValue]: 0x00000000
0x8 Size [unsigned short:Size]: 0x00000000
0xa ContextValue [unsigned short:ContextValue]: 0x00000000
0xa Flags [Flags:Flags]: 0x00000000 ()
0xb SmallTagIndex [unsigned char:SmallTagIndex]: 0x00000000
0xc Code2 [unsigned short:Code2]: 0x00000000
0xc PreviousSize [unsigned short:PreviousSize]: 0x00000000
0xc UnusedBytesLength [unsigned short:UnusedBytesLength]: 0x00000000
0xe Code3 [unsigned char:Code3]: 0x00000000
0xe EntryOffset [unsigned char:EntryOffset]: 0x00000000
0xe LFHFlags [unsigned char:LFHFlags]: 0x00000000
0xe SegmentOffset [unsigned char:SegmentOffset]: 0x00000000
0xf Code4 [unsigned char:Code4]: 0x00000000
0xf ExtendedBlockSignature [unsigned char:ExtendedBlockSignature]: 0x00000000
0xf UnusedBytes [unsigned char:UnusedBytes]: 0x00000000
For now I will point out the Size and PreviousSize members of the header (Both are expressed in terms of allocation blocks - 16 bytes on AMD64). This means that it is possible to follow_HEAP_ENTRY structs along the Segment from start to end. In fact one can notice that many heap structs (e.g. _HEAP_HEAP_SEGMENT) start with a _HEAP_ENTRY. One can start at the start of the segment and walk the entries to the end of the segment.
Most of the smarts in the Back End allocator is about managing allocated and freed entries. The backend always maintains the property that _HEAP_ENTRYs can be walked over to enumerate them all. Since we only really care about enumerating all user allocations we don’t particularly care about the specific algorithms the heap uses to manage its free lists, only where the final chunks are to be found.
There is a small trick though. In order to prevent traditional heap overflow attacks, the _HEAP_ENTRY is encoded by XORing it with a unique heap specific key. Therefore before we can read the_HEAP_ENTRY we must XOR it with _HEAP.Encoding.
I have written a plugin that can be used to visualize these allocations. For each heap it lists the segment and then enumerates the heap entries (after decoding them with the heap key) and displays the first few bytes of each allocation. In our case only the last heap is interesting:
[1] output.E01 10:25:02> inspect_heap proc_regex="heap", heaps=[4]
DEBUG:root:Switching to process context: heap.exe (Pid 2628@0xfa8002c04060)
**************************************************
[_EPROCESS _EPROCESS] @ 0xFA8002C04060 (pid=2628)
Heap 4: 0x3c0000 (LOW_FRAG)
Backend Info:

Segment End Length Data
--------------- -------------- ---------- ----
. 0x3c0040 0x3d0000 65472
.. 0x3c0a80 0x3c12e0 2128 00 00 00 00 00 00 00 00 00 01 00 00 00 00 00 00 ................
.. 0x3c12e0 0x3c15b0 704 50 03 00 00 00 00 00 00 ff ff ff ff ff ff ff ff P...............
.. 0x3c15b0 0x3c20c0 2816 03 00 00 00 00 00 00 00 c1 0a 00 00 01 00 00 00 ................
.. 0x3c20c0 0x3c28c0 2032 30 c5 3d 00 00 00 00 00 20 9a 3c 00 00 00 00 00 0.=.......<.....
.. 0x3c28c0 0x3c2900 48 46 00 72 00 61 00 6d 00 65 00 77 00 6f 00 72 00 F.r.a.m.e.w.o.r.
.. 0x3c2900 0x3c2ad0 448 49 00 4e 00 43 00 4c 00 55 00 44 00 45 00 3d 00 I.N.C.L.U.D.E.=.
.. 0x3c2ad0 0x3c2c00 288 4c 00 49 00 42 00 3d 00 63 00 3a 00 5c 00 50 00 L.I.B.=.c.:.\.P.
.. 0x3c2c00 0x3c2c60 80 4c 00 4f 00 43 00 41 00 4c 00 41 00 50 00 50 00 L.O.C.A.L.A.P.P.
.. 0x3c2c60 0x3c2ca0 48 4e 00 55 00 4d 00 42 00 45 00 52 00 5f 00 4f 00 N.U.M.B.E.R._.O.
.. 0x3c2ca0 0x3c2d30 128 50 00 41 00 54 00 48 00 45 00 58 00 54 00 3d 00 P.A.T.H.E.X.T.=.
....
.. 0x3c7700 0x3c7f00 2032 00 c5 3d 00 00 00 00 00 58 01 3c 00 00 00 00 00 ..=.....X.<.....
....
.. 0x3c8fd0 0x3c9020 64 38 54 68 65 20 71 75 69 63 6b 20 62 72 6f 77 6e 8The.quick.brown
.. 0x3c9020 0x3c9070 64 3a 54 68 65 20 71 75 69 63 6b 20 62 72 6f 77 6e :The.quick.brown
.. 0x3c9070 0x3c90c0 64 3b 54 68 65 20 71 75 69 63 6b 20 62 72 6f 77 6e ;The.quick.brown
.. 0x3c90c0 0x3c9120 80 49 54 68 65 20 71 75 69 63 6b 20 62 72 6f 77 6e IThe.quick.brown
.. 0x3c9120 0x3c9180 80 4a 54 68 65 20 71 75 69 63 6b 20 62 72 6f 77 6e JThe.quick.brown
.. 0x3c9180 0x3c91e0 80 4c 54 68 65 20 71 75 69 63 6b 20 62 72 6f 77 6e LThe.quick.brown
.. 0x3c91e0 0x3c9240 80 4d 54 68 65 20 71 75 69 63 6b 20 62 72 6f 77 6e MThe.quick.brown
.. 0x3c9240 0x3c92a0 80 4f 54 68 65 20 71 75 69 63 6b 20 62 72 6f 77 6e OThe.quick.brown
.. 0x3c92a0 0x3c9300 80 50 54 68 65 20 71 75 69 63 6b 20 62 72 6f 77 6e PThe.quick.brown
.. 0x3c9300 0x3c9360 80 52 54 68 65 20 71 75 69 63 6b 20 62 72 6f 77 6e RThe.quick.brown
...
.. 0x3caba0 0x3cbba0 4080 60 c5 3d 00 00 00 00 00 e0 8f 3c 00 00 00 00 00 `.=.......<.....
.. 0x3cbba0 0x3ccba0 4080 90 c5 3d 00 00 00 00 00 d0 90 3c 00 00 00 00 00 ..=.......<.....
.. 0x3ccba0 0x3cdba0 4080 c0 c5 3d 00 00 00 00 00 90 94 3c 00 00 00 00 00 ..=.......<.....
.. 0x3cdba0 0x3cdc10 96 65 54 68 65 20 71 75 69 63 6b 20 62 72 6f 77 6e eThe.quick.brown
We can see some of the allocations that our program made in the output, but closely examining the data shows that not all allocations are found.

2.2. The Front End Allocator.

On Windows 7 the only Front End Allocator available is the Low Fragmentation Heap (LFH) front end. The front end is set for a particular heap in the _HEAP.FrontEndHeapType enumeration which can be 0 (backend only) or 2 (LFH). The _LFH_HEAP struct contains the low fragmentation heap and is set in _HEAP.FrontEndHeap if it is used. In the following discussion is skip over some of the low level details so please take a look at the source code for the inspect_heap plugin for the gory details.
The heap starts off with only a backend allocator active. If the heap heuristics detect that the application might benefit from a low fragmentation heap, the LFH is created and added to the heap. Note that LFH is only used for smallish allocations. Larger allocations still end up going to the backend directly.
The LFH claims sub-segments from the backend allocator. Each subsegment starts with a _HEAP_USERDATA_HEADER and it is followed by an array of allocations of the same size. Each such allocation has a _HEAP_ENTRY at the start. To the backend allocator the subsegments simply look like largish opaque allocations (and are therefore also contained in a backend _HEAP_ENTRY ).
The LFH reuses the _HEAP_ENTRY struct (again encoded with the heap’s key) to describe each allocation, but since all entries in a subsegments are the same size, there is no need to use Size andPreviousSize to track them. The _HEAP_ENTRY.UnusedBytes member describes how many bytes are unused in the allocation (e.g. if the allocation is 20 bytes but the user only wanted 18 bytes there are 2 bytes unused), and also contains flags to indicate if the entry is BUSY or FREE.
We can see the LFH allocations for our example (output just follows the previous command):
Low Fragmentation Front End Information:
Entry Alloc Length Data
-------------- ------ ------ ----
0x3c7730 32 21 54 41 52 47 45 54 5f 50 4c 41 54 46 4f 52 4d 3d TARGET_PLATFORM=
57 49 4e 37 00 WIN7.
0x3c7750 32 17 54 6f 6f 6c 73 56 65 72 73 69 6f 6e 3d 34 2e 30 ToolsVersion=4.0
00 .
0x3c7770 32 15 55 53 45 52 44 4f 4d 41 49 4e 3d 64 65 76 00 USERDOMAIN=dev.
0x3c7790 32 13 55 53 45 52 4e 41 4d 45 3d 6d 69 63 00 USERNAME=mic.
0x3c77b0 32 18 77 69 6e 64 69 72 3d 43 3a 5c 57 69 6e 64 6f 77 windir=C:\Window
73 00 s.
0x3c77d0 32 24 e0 16 ab 6d 00 00 00 00 98 9a ab 6d 00 00 00 00 ...m.......m....
00 00 00 00 00 00 00 00 ........
0x3c77f0 32 22 41 00 50 00 50 00 56 00 45 00 52 00 3d 00 36 00 A.P.P.V.E.R.=.6.
2e 00 31 00 00 00 ..1...
0x3c7810 32 24 50 00 52 00 4f 00 4d 00 50 00 54 00 3d 00 24 00 P.R.O.M.P.T.=.$.
50 00 24 00 47 00 00 00 P.$.G...
0x3c7830 32 9 08 54 68 65 20 71 75 69 00 .The.qui.
0x3c7850 32 11 0a 54 68 65 20 71 75 69 63 6b 00 .The.quick.
0x3c7870 32 12 0b 54 68 65 20 71 75 69 63 6b 20 00 .The.quick..
0x3c7890 32 14 0d 54 68 65 20 71 75 69 63 6b 20 62 72 00 .The.quick.br.
0x3c78b0 32 15 0e 54 68 65 20 71 75 69 63 6b 20 62 72 6f 00 .The.quick.bro.
0x3c78d0 32 17 10 54 68 65 20 71 75 69 63 6b 20 62 72 6f 77 6e .The.quick.brown
00 .
0x3c78f0 32 18 11 54 68 65 20 71 75 69 63 6b 20 62 72 6f 77 6e .The.quick.brown
20 00 ..
0x3c7910 32 20 13 54 68 65 20 71 75 69 63 6b 20 62 72 6f 77 6e .The.quick.brown
20 66 6f 00 .fo.
0x3c7930 32 21 14 54 68 65 20 71 75 69 63 6b 20 62 72 6f 77 6e .The.quick.brown
20 66 6f 78 00 .fox.
0x3c7950 32 23 16 54 68 65 20 71 75 69 63 6b 20 62 72 6f 77 6e .The.quick.brown
20 66 6f 78 20 6a 00 .fox.j.
0x3c7970 32 24 17 54 68 65 20 71 75 69 63 6b 20 62 72 6f 77 6e .The.quick.brown
20 66 6f 78 20 6a 75 00 .fox.ju.
....
0x3c2390 48 26 19 54 68 65 20 71 75 69 63 6b 20 62 72 6f 77 6e .The.quick.brown
20 66 6f 78 20 6a 75 6d 70 69 .fox.jumpi
0x3c23c0 48 27 1a 54 68 65 20 71 75 69 63 6b 20 62 72 6f 77 6e .The.quick.brown
20 66 6f 78 20 6a 75 6d 70 65 5c .fox.jumpe\
0x3c23f0 48 29 1c 54 68 65 20 71 75 69 63 6b 20 62 72 6f 77 6e .The.quick.brown
20 66 6f 78 20 6a 75 6d 70 65 64 20 74 .fox.jumped.t
0x3c2420 48 30 1d 54 68 65 20 71 75 69 63 6b 20 62 72 6f 77 6e .The.quick.brown
20 66 6f 78 20 6a 75 6d 70 65 64 20 6f 63 .fox.jumped.oc
0x3c2450 48 32 1f 54 68 65 20 71 75 69 63 6b 20 62 72 6f 77 6e .The.quick.brown
20 66 6f 78 20 6a 75 6d 70 65 64 20 6f 76 65 4c .fox.jumped.oveL
0x3c2480 48 33 20 54 68 65 20 71 75 69 63 6b 20 62 72 6f 77 6e .The.quick.brown
20 66 6f 78 20 6a 75 6d 70 65 64 20 6f 76 65 72 .fox.jumped.over
2e .
0x3c24b0 48 35 22 54 68 65 20 71 75 69 63 6b 20 62 72 6f 77 6e "The.quick.brown
20 66 6f 78 20 6a 75 6d 70 65 64 20 6f 76 65 72 .fox.jumped.over
20 74 31 .t1
.....
We can see a series of allocations of size 0x20 which can hold strings up to size 24 (8 bytes must be reserved for the _HEAP_ENTRY header). Further allocations must skip to the next sub-segment which contains allocations of size 48. Note also that as far as the backend is concerned each of the sub-segments are unique opaque allocations in their own right (they appear in the previous listing too) but the backend does not see inside the subsegments to enumerate the smaller allocations. Note that the allocation of size 25 is missing since it was freed (i=24 and 24 % 3 == 0) and then probably reused for allocation of size 26.
You can verify that all the allocated strings can be enumerated by a combination of front end and back end enumerations.
It is instructive to see the allocations using the regular Rekall dump plugin to view a hexdump of the allocations (We must remember to switch to the correct process context first using the cc plugin so we can read the process address space):
[1] output.E01 11:09:06> cc proc_regex="heap"
Switching to process context: heap.exe (Pid 2628@0xfa8002c04060)
[1] output.E01 11:30:06> dump 0x3c7950
Offset Hex Data
-------------- ------------------------------------------------ ----------------
0x3c7950 20 66 6f 78 00 00 00 00 80 f9 a4 45 19 00 00 89 .fox.......E....
0x3c7960 16 54 68 65 20 71 75 69 63 6b 20 62 72 6f 77 6e .The.quick.brown
0x3c7970 20 66 6f 78 20 6a 00 00 82 f9 a4 45 19 00 00 88 .fox.j.....E....
0x3c7980 17 54 68 65 20 71 75 69 63 6b 20 62 72 6f 77 6e .The.quick.brown
0x3c7990 20 66 6f 78 20 6a 75 00 8c f9 a4 45 19 00 00 80 .fox.ju....E....
0x3c79a0 2a 00 00 00 00 00 00 00 00 00 00 00 00 00 00 00 *...............
The inspect_heap plugin indicates that the entry at offset 0x3c7950 is an allocation of length 23 bytes. This offset contains an _HEAP_ENTRY struct, but we can see a weird effect - the first 8 bytes appear to belong to the previous allocation. This is a weird implementation detail of the Microsoft heap. The first 8 bytes of the _HEAP_ENTRY struct (which is normally 16 bytes long) are actually reserved for the previous allocation and named _HEAP_ENTRY.PreviousBlockPrivateData. An allocation is allowed to overflow up to 8 bytes into the next _HEAP_ENTRY. Therefore for an allocation of size 32 bytes, there are 24 user usable bytes. It is useful to recognize this effect when looking at the hexdump of raw memory. This effect only occurs on 64 bit systems.
The next 4 bytes belong to the _HEAP_ENTRY but before we read them we need to decode the entry using the heap key. The final byte (0x89) is the UnusedBytes field which is not encoded. In the LFH this field can be ANDed with 0x38 to determine if the allocation is BUSY or FREE. Subtracting 0x88 gives the number of unused bytes in the allocation (in the above case 1 byte unused).

3. The Windows DNS Resolver.

So now we have the ability to enumerate all application heap allocations. So what can we use this for? As an example I chose to examine the windows DNS resolver service. This is implemented as an in-process service (i.e. it is running as a thread in a shared process with other services). The resolver is implemented using dnsrslvr.dll which is linked into one of the svchost.exe shared service hosting processes.
To test this I used Chrome to browse to a bunch of websites and then ensured that the DNS cache was populated, and obtained a memory image.
You can check the DNS cache using the ipconfig /displaydns command:
C:\Program Files\Rekall>ipconfig /displaydns

Windows IP Configuration

clients4.google.com
----------------------------------------
Record Name . . . . . : clients4.google.com
Record Type . . . . . : 5
Time To Live . . . . : 3566
Data Length . . . . . : 8
Section . . . . . . . : Answer
CNAME Record . . . . : clients.l.google.com

code.jquery.com
----------------------------------------
Record Name . . . . . : code.jquery.com
Record Type . . . . . : 5
Time To Live . . . . : 3577
Data Length . . . . . : 8
Section . . . . . . . : Answer
CNAME Record . . . . : code.jquery.netdna-cdn.com

apis.google.com
----------------------------------------
Record Name . . . . . : apis.google.com
Record Type . . . . . : 5
Time To Live . . . . : 3571
Data Length . . . . . : 8
Section . . . . . . . : Answer
CNAME Record . . . . : plus.l.google.com

www.google.com
----------------------------------------
Record Name . . . . . : www.google.com
Record Type . . . . . : 1
Time To Live . . . . : 3539
Data Length . . . . . : 4
Section . . . . . . . : Answer
A (Host) Record . . . : 173.194.72.147

Record Name . . . . . : www.google.com
Record Type . . . . . : 1
Time To Live . . . . : 3539
Data Length . . . . . : 4
Section . . . . . . . : Answer
A (Host) Record . . . : 173.194.72.99
At this stage we have zero knowledge of how the resolver cache works, but we know it stores DNS records, hostnames and IP addresses. We can imagine that it stores these on the heap and probably has some data structures it uses to maintain these details. Usually before an application creates a new data structure it must allocate the memory from the heap - normally the exact size of the allocation depends on the data structure (so it can fit in the allocated memory). So examining the allocation of the resolver cache might give us a clue as to how it organizes its own data.
The first step is to find the process where the resolver is running in. We use the vad plugin to locate the svchost process which hosts the dnsrslvr.dll (filter by both process name and VAD filename):
[1] output.E01 11:46:45> vad proc_regex="svchost", regex="dnsrslvr.dll"
.... [uninteresting output omitted]

Pid: 1076 svchost.exe
VAD lev Start Addr End Addr com Protect Filename
-------------- --- -------------- -------------- ---- ------- ------ -------------------- --------
0xfa800271fb80 4 0x07fef9a20000 0x07fef9a4ffff 4 Mapped Exe EXECUTE_WRITECOPY \Windows\System32\dnsrslvr.dll
Ok great. This tells us the process we care about has a pid of 1076 and that the DLL is mapped in the range 0x07fef9a20000-0x07fef9a4ffff. Lets inspect its heaps. There is a lot of output here - the process has 12 heaps with a lot of allocations. However, we can immediately recognize some of the hostnames we are looking for in heap number 4:
[1] output.E01 12:08:26> inspect_heap pid=1076, heaps=[4]
DEBUG:root:Switching to process context: svchost.exe (Pid 1076@0xfa800271c630)
**************************************************
[_EPROCESS _EPROCESS] @ 0xFA800271C630 (pid=1076)
Heap 4: 0x11a0000 (BACKEND)
Backend Info:

Segment End Length Data
--------------- -------------- ---------- ----
. 0x11a0040 0x1220000 524224
.. 0x11a0a80 0x11a12f0 2144 00 00 00 00 00 00 00 00 00 01 00 00 00 00 00 00 ................
.. 0x11a12f0 0x11a1500 512 00 13 1a 01 00 00 00 00 00 13 1a 01 00 00 00 00 ................
.. 0x11a1500 0x11a2240 3376 10 15 1a 01 00 00 00 00 10 15 1a 01 00 00 00 00 ................
.. 0x11a2240 0x11a2280 48 d0 22 1a 01 00 00 00 00 40 93 a4 f9 fe 07 00 00 ."......@.......
.. 0x11a2280 0x11a22c0 48 d0 22 1a 01 00 00 00 00 50 22 1a 01 00 00 00 00 ."......P"......
.. 0x11a22c0 0x11a2300 48 10 23 1a 01 00 00 00 00 50 22 1a 01 00 00 00 00 .#......P"......
.. 0x11a2300 0x11a2340 48 50 23 1a 01 00 00 00 00 d0 22 1a 01 00 00 00 00 P#......."......
.. 0x11a2340 0x11a2380 48 90 23 1a 01 00 00 00 00 10 23 1a 01 00 00 00 00 .#.......#......
.. 0x11a2380 0x11a23c0 48 40 32 1a 01 00 00 00 00 50 23 1a 01 00 00 00 00 @2......P#......
.. 0x11a23c0 0x11a23f0 32 07 00 00 00 30 75 00 00 60 ea 00 00 c0 d4 01 00 ....0u..`.......
.. 0x11a23f0 0x11a2410 16 64 00 65 00 76 00 00 00 58 01 1a 01 00 00 00 00 d.e.v...X.......
.. 0x11a2410 0x11a24a0 128 02 00 78 00 05 00 00 00 00 00 14 00 00 00 00 10 ..x.............
.. 0x11a24a0 0x11a24e0 48 01 00 04 00 00 00 00 00 c0 d3 51 00 00 00 00 00 ..........Q.....
.. 0x11a24e0 0x11a25e0 240 00 00 00 00 00 00 00 00 f0 25 1a 01 00 00 00 00 .........%......
.. 0x11a25e0 0x11a2600 16 64 00 65 00 76 00 00 00 58 01 1a 01 00 00 00 00 d.e.v...X.......
.. 0x11a2600 0x11a2620 16 00 00 00 00 00 00 00 00 00 00 00 00 00 00 00 00 ................
.. 0x11a2620 0x11a2680 80 7b 00 32 00 31 00 43 00 35 00 30 00 31 00 36 00 {.2.1.C.5.0.1.6.
.. 0x11a2680 0x11a26c0 48 4c 00 6f 00 63 00 61 00 6c 00 20 00 41 00 72 00 L.o.c.a.l...A.r.
.. 0x11a26c0 0x11a2770 160 02 00 00 00 02 00 00 00 00 00 00 00 00 00 00 00 ................
.. 0x11a2770 0x11a27e0 96 01 00 00 00 01 00 00 00 00 00 00 00 00 00 00 00 ................
.. 0x11a27e0 0x11a2840 80 7b 00 31 00 41 00 38 00 34 00 44 00 37 00 44 00 {.1.A.8.4.D.7.D.
.. 0x11a2840 0x11a28a0 80 54 00 65 00 72 00 65 00 64 00 6f 00 20 00 54 00 T.e.r.e.d.o...T.
.. 0x11a28a0 0x11a28d0 32 ac 02 00 00 00 00 00 00 50 05 00 00 00 00 00 00 ........P.......
.. 0x11a28d0 0x11a2900 32 10 2b 1a 01 00 00 00 00 c0 3b 1c 01 00 00 00 00 .+.......;......
.. 0x11a2900 0x11a2920 16 64 00 65 00 76 00 00 00 58 01 1a 01 00 00 00 00 d.e.v...X.......
.. 0x11a2920 0x11a2980 80 90 2a 1a 01 00 00 00 00 10 37 1c 01 00 00 00 00 .*.......7......
.. 0x11a2980 0x11a29d0 64 4c 00 6f 00 63 00 61 00 6c 00 20 00 41 00 72 00 L.o.c.a.l...A.r.
.. 0x11a29d0 0x11a2a10 48 b0 6b 1f 01 00 00 00 00 60 2a 1a 01 00 00 00 00 .k......`*......
.. 0x11a2a10 0x11a2a50 48 70 00 79 00 74 00 68 00 6f 00 6e 00 2e 00 6d 00 p.y.t.h.o.n...m.
.. 0x11a2a50 0x11a2a80 32 77 00 77 00 77 00 2e 00 70 00 79 00 74 00 68 00 w.w.w...p.y.t.h.
.. 0x11a2a80 0x11a2ae0 80 40 2c 1a 01 00 00 00 00 30 29 1a 01 00 00 00 00 @,......0)......
.. 0x11a2ae0 0x11a2b00 16 00 00 00 00 00 00 00 00 00 00 00 00 00 00 00 00 ................
.. 0x11a2b00 0x11a2b30 32 60 56 1f 01 00 00 00 00 e0 28 1a 01 00 00 00 00 `V.......(......
.. 0x11a2b30 0x11a2b70 48 00 2c 1a 01 00 00 00 00 c0 2b 1a 01 00 00 00 00 .,.......+......
.. 0x11a2b70 0x11a2bb0 48 63 00 6c 00 69 00 65 00 6e 00 74 00 73 00 2e 00 c.l.i.e.n.t.s...
.. 0x11a2bb0 0x11a2bf0 48 63 00 6c 00 69 00 65 00 6e 00 74 00 73 00 34 00 c.l.i.e.n.t.s.4.
.. 0x11a2bf0 0x11a2c30 48 d0 35 1c 01 00 00 00 00 90 35 1c 01 00 00 00 00 .5.......5......
.. 0x11a2c30 0x11a2cd0 144 c0 69 1f 01 00 00 00 00 90 2a 1a 01 00 00 00 00 .i.......*......
.. 0x11a2cd0 0x11a2cf0 16 64 00 65 00 76 00 00 00 58 01 1a 01 00 00 00 00 d.e.v...X.......
.. 0x11a2cf0 0x11a2d10 16 20 32 1a 01 00 00 00 00 58 01 1a 01 00 00 00 00 .2......X.......
.. 0x11a2d10 0x11a2dc0 160 02 00 00 00 02 00 00 00 00 00 00 00 00 00 00 00 ................
.. 0x11a2dc0 0x11a2ec0 240 02 00 00 00 02 00 00 00 00 00 00 00 00 00 00 00 ................
.. 0x11a2ec0 0x11a2f00 48 67 00 6f 00 6f 00 67 00 6c 00 65 00 61 00 70 00 g.o.o.g.l.e.a.p.
.. 0x11a2f00 0x11a2f50 64 74 00 72 00 61 00 6e 00 73 00 6c 00 61 00 74 00 t.r.a.n.s.l.a.t.
.. 0x11a2f50 0x11a2f90 48 20 30 1a 01 00 00 00 00 e0 2f 1a 01 00 00 00 00 .0......./......
.. 0x11a2f90 0x11a2fd0 48 63 00 6c 00 69 00 65 00 6e 00 74 00 73 00 2e 00 c.l.i.e.n.t.s...
.. 0x11a2fd0 0x11a3010 48 63 00 6c 00 69 00 65 00 6e 00 74 00 73 00 31 00 c.l.i.e.n.t.s.1.
.. 0x11a3010 0x11a3050 48 a0 30 1a 01 00 00 00 00 60 30 1a 01 00 00 00 00 .0......`0......
.. 0x11a3050 0x11a3090 48 63 00 6c 00 69 00 65 00 6e 00 74 00 73 00 2e 00 c.l.i.e.n.t.s...
.. 0x11a3090 0x11a30d0 48 e0 30 1a 01 00 00 00 00 00 00 00 00 00 00 00 00 .0..............
.. 0x11a30d0 0x11a3120 64 d0 5f 1f 01 00 00 00 00 00 00 00 00 00 00 00 00 ._..............
.. 0x11a3120 0x11a3160 48 90 36 1c 01 00 00 00 00 10 2f 1a 01 00 00 00 00 .6......./......
.. 0x11a3160 0x11a31a0 48 e0 31 1a 01 00 00 00 00 b0 31 1a 01 00 00 00 00 .1.......1......
.. 0x11a31a0 0x11a31d0 32 77 00 77 00 77 00 2e 00 67 00 6f 00 6f 00 67 00 w.w.w...g.o.o.g.
.. 0x11a31d0 0x11a3210 48 e0 3b 1c 01 00 00 00 00 00 00 00 00 00 00 00 00 .;..............
.. 0x11a3210 0x11a3230 16 d0 37 1c 01 00 00 00 00 00 2d 1a 01 00 00 00 00 .7.......-......
.. 0x11a3230 0x11a3270 48 40 93 a4 f9 fe 07 00 00 90 23 1a 01 00 00 00 00 @........#......
.. 0x11a3270 0x11b33a0 65824 00 00 00 00 00 00 00 00 00 00 00 00 00 00 00 00 ................
.. 0x11b33a0 0x11c34d0 65824 00 00 00 00 00 00 00 00 00 00 00 00 00 00 00 00 ................
.. 0x11c34d0 0x11c3580 160 f0 65 1f 01 00 00 00 00 40 2c 1a 01 00 00 00 00 .e......@,......
.. 0x11c3580 0x11c35c0 48 63 00 6c 00 69 00 65 00 6e 00 74 00 73 00 2e 00 c.l.i.e.n.t.s...
.. 0x11c35c0 0x11c3600 48 10 36 1c 01 00 00 00 00 00 00 00 00 00 00 00 00 .6..............
.. 0x11c3600 0x11c3640 48 50 36 1c 01 00 00 00 00 00 00 00 00 00 00 00 00 P6..............
.. 0x11c3640 0x11c3680 48 00 00 00 00 00 00 00 00 00 00 00 00 00 00 00 00 ................
.. 0x11c3680 0x11c36c0 48 00 00 00 00 00 00 00 00 d0 36 1c 01 00 00 00 00 .........6......
.. 0x11c36c0 0x11c3700 48 67 00 6f 00 6f 00 67 00 6c 00 65 00 61 00 70 00 g.o.o.g.l.e.a.p.
.. 0x11c3700 0x11c3760 80 30 29 1a 01 00 00 00 00 60 56 1f 01 00 00 00 00 0)......`V......
.. 0x11c3760 0x11c37c0 80 7b 00 32 00 31 00 43 00 35 00 30 00 31 00 36 00 {.2.1.C.5.0.1.6.
.. 0x11c37c0 0x11c37e0 16 f0 39 1c 01 00 00 00 00 20 32 1a 01 00 00 00 00 .9.......2......
.. 0x11c37e0 0x11c3830 64 63 00 6f 00 64 00 65 00 2e 00 6a 00 71 00 75 00 c.o.d.e...j.q.u.
.. 0x11c3830 0x11c3870 48 d0 38 1c 01 00 00 00 00 80 38 1c 01 00 00 00 00 .8.......8......
.. 0x11c3870 0x11c38c0 64 63 00 6f 00 64 00 65 00 2e 00 6a 00 71 00 75 00 c.o.d.e...j.q.u.
.. 0x11c38c0 0x11c3900 48 00 00 00 00 00 00 00 00 00 00 00 00 00 00 00 00 ................
.. 0x11c3900 0x11c3930 32 64 00 65 00 76 00 00 00 58 01 1a 01 00 00 00 00 d.e.v...X.......
.. 0x11c3930 0x11c3970 48 b0 39 1c 01 00 00 00 00 80 39 1c 01 00 00 00 00 .9.......9......
.. 0x11c3970 0x11c39a0 32 73 00 73 00 6c 00 2e 00 67 00 73 00 74 00 61 00 s.s.l...g.s.t.a.
.. 0x11c39a0 0x11c39e0 48 00 00 00 00 00 00 00 00 00 00 00 00 00 00 00 00 ................
.. 0x11c39e0 0x11c3a00 16 c0 3b 1c 01 00 00 00 00 d0 37 1c 01 00 00 00 00 .;.......7......
.. 0x11c3a00 0x11c3a40 48 e0 3a 1c 01 00 00 00 00 a0 3a 1c 01 00 00 00 00 .:.......:......
.. 0x11c3a40 0x11c3a90 64 65 00 31 00 30 00 30 00 38 00 38 00 2e 00 64 00 e.1.0.0.8.8...d.
.. 0x11c3a90 0x11c3ad0 48 77 00 77 00 77 00 2e 00 6d 00 69 00 63 00 72 00 w.w.w...m.i.c.r.
.. 0x11c3ad0 0x11c3b10 48 60 3c 1c 01 00 00 00 00 70 3b 1c 01 00 00 00 00 `<......p;......
.. 0x11c3b10 0x11c3b60 64 74 00 6f 00 67 00 67 00 6c 00 65 00 2e 00 77 00 t.o.g.g.l.e...w.
.....
Note
Windows can have many heaps in each process. Sometimes an application can deliberately create multiple heaps to keep similar data together for some reason. Often data within the same heap is somehow related - as in this case - all the data in this heap involves the DNS resolver.
This makes it easier to make sense of data since its more likely that the data we are looking for exist in this heap.
We can see some host names allocated in this heap. This makes sense - the application must have data structures to maintain state and these should have pointers to the allocated strings from the heap. For example consider the string "www.google.com" at allocation offset 0x11a31a0. There should be a pointer somewhere pointing to this string (Note that 0x11a31a0 is the offset to the_HEAP_ENTRY - the user allocation is 16 bytes later). We can use the grep plugin to find this pointer. We first assume it is located in this heap so we start the search from the heap’s starting address 0x11a0040:
[1] output.E01 12:33:03> cc 1076
Switching to process context: svchost.exe (Pid 1076@0xfa800271c630)
[1] output.E01 12:33:21> grep 0x11a0040, keyword="\xb0\x31\x1a\x01"
Offset Hex Data
-------------- ------------------------------------------------------------ --------------------
0x11a3164 00 00 00 00 e1 42 36 20 30 a1 00 1c e0 31 1a 01 00 00 00 00 .....B6.0....1......
0x11a3178 b0 31 1a 01 00 00 00 00 01 00 04 00 09 20 03 00 4a 20 01 00 .1..............J...
We can see a pointer to this string located at offset 0x11a3178 which exists inside an allocation of size 48 at heap entry 0x11a3160 (Struct starts at 0x11a3170):
[1] output.E01 12:36:04> dump 0x11a3170
Offset Hex Data
-------------- ------------------------------------------------ ----------------
0x11a3170 e0 31 1a 01 00 00 00 00 b0 31 1a 01 00 00 00 00 .1.......1......
0x11a3180 01 00 04 00 09 20 03 00 4a 20 01 00 01 00 00 00 ........J.......
0x11a3190 ad c2 48 93 2e 00 63 00 6f 00 6d 00 00 00 00 00 ..H...c.o.m.....

[1] output.E01 12:55:25> dump 0x11a31e0
Offset Hex Data
-------------- ------------------------------------------------ ----------------
0x11a31e0 e0 3b 1c 01 00 00 00 00 00 00 00 00 00 00 00 00 .;..............
0x11a31f0 01 00 04 00 09 00 00 00 4a 20 01 00 01 00 00 00 ........J.......
0x11a3200 ad c2 48 63 6c 00 64 00 6c 00 2e 00 77 00 69 00 ..Hcl.d.l...w.i.

[1] output.E01 13:00:44> dump 0x11c3be0
Offset Hex Data
-------------- ------------------------------------------------ ----------------
0x11c3be0 20 3c 1c 01 00 00 00 00 00 00 00 00 00 00 00 00 .<..............
0x11c3bf0 01 00 04 00 09 00 00 00 4a 20 01 00 01 00 00 00 ........J.......
0x11c3c00 ad c2 48 68 0a 00 02 03 00 00 00 00 00 00 00 00 ..Hh............

[1] output.E01 13:03:36> dump 0x11c3c20
Offset Hex Data
-------------- ------------------------------------------------ ----------------
0x11c3c20 00 00 00 00 00 00 00 00 00 00 00 00 00 00 00 00 ................
0x11c3c30 01 00 04 00 09 00 00 00 4a 20 01 00 01 00 00 00 ........J.......
0x11c3c40 ad c2 48 6a 00 00 00 00 00 00 00 00 00 00 00 00 ..Hj............
The struct itself starts at offset 0x11a3170. There are two pointers back to this heap, the first points at 0x11a31e0, the second back at the string "www.google.com". We also see a short integer of value 1 - comparing to the output of ipconfig, this is the type. The next short integer is of size 4 (Data length). We see the data at offset 0x11a3190 representing the IPv4 address (173.194.72.147).
If we dump the contents at the first pointer we can see a very similar struct. We can repeat to see a series of very similar structs all containing the different IPv4 addresses for www.google.com.
Lets name this the DNS_RECORD struct. Examining other similar structs gives examples for ones with Type = 5:
[1] output.E01 13:08:33> dump 0x11c3c60
Offset Hex Data
-------------- ------------------------------------------------ ----------------
0x11c3c60 40 3d 1c 01 00 00 00 00 f0 3c 1c 01 00 00 00 00 @=.......<......
0x11c3c70 05 00 08 00 09 30 00 00 60 20 01 00 01 00 00 00 .....0..`.......
0x11c3c80 a0 3c 1c 01 00 00 00 00 00 00 00 00 00 00 00 00 .<..............

[1] output.E01 13:08:38> dump 0x11c3ca0
Offset Hex Data
-------------- ------------------------------------------------ ----------------
0x11c3ca0 77 00 77 00 77 00 2e 00 6d 00 69 00 63 00 72 00 w.w.w...m.i.c.r.
0x11c3cb0 6f 00 73 00 6f 00 66 00 74 00 2e 00 63 00 6f 00 o.s.o.f.t...c.o.
0x11c3cc0 6d 00 2e 00 65 00 64 00 67 00 65 00 6b 00 65 00 m...e.d.g.e.k.e.
0x11c3cd0 79 00 2e 00 6e 00 65 00 74 00 00 00 00 00 00 00 y...n.e.t.......
In this case we can see that the data field is a pointer to a string containing the CNAME record.
We can already write its definition like:
# Most common DNS types.
DNS_TYPES ={
1:"A",
5:"CNAME",
28:"AAAA",
}

types ={
"DNS_RECORD":[None,{
"Next":[0,["Pointer",dict(
target="DNS_RECORD"
)]],
"Name":[8,["Pointer",dict(
target="UnicodeString"
)]],
"Type":[16,["Enumeration",dict(
choices=DNS_TYPES,
target="unsigned short"
)]],
"DataLength":[18,['unsigned short']],
"Data":[0x20,['char']],
}],
}

classDNS_RECORD(obj.Struct):
@property
defData(self):
if self.Type =="CNAME":
return self.m("Data").cast(
"Pointer", target="UnicodeString").deref()
elif self.Type =="A":
return utils.inet_ntop(
socket.AF_INET, self.obj_vm.read(self.m("Data").obj_offset,4))
Just like we followed the Next pointer before we can also try to follow this list in reverse using the grep plugin to see where each struct is referenced from.
[1] output.E01 13:13:28> grep 0x11a0040, keyword="\x70\x31\x1a\x01"
Offset Hex Data
-------------- ------------------------------------------------------------ --------------------

[1] output.E01 13:15:17> grep 0x20f0000, keyword="\x70\x31\x1a\x01"
-----------------------> grep(0x20f0000, keyword="\x70\x31\x1a\x01")
Offset Hex Data
-------------- ------------------------------------------------------------ --------------------
0x20f1c84 00 00 00 00 b0 1c 0f 02 00 00 00 00 00 00 00 00 03 00 00 00 ....................
0x20f1c98 70 31 1a 01 00 00 00 00 00 00 00 00 00 00 00 00 00 00 00 00 p1..................

[1] output.E01 13:15:14> inspect_heap pid=1076, heaps=[12]
[_EPROCESS _EPROCESS] @ 0xFA800271C630 (pid=1076)
Heap 12: 0x20f0000 (BACKEND)
Backend Info:

Segment End Length Data
--------------- -------------- ---------- ----
. 0x20f0040 0x2100000 65472
.. 0x20f0a80 0x20f12e0 2128 00 00 00 00 00 00 00 00 00 01 00 00 00 00 00 00 ................
.. 0x20f12e0 0x20f1980 1680 00 00 00 00 00 00 00 00 00 00 00 00 00 00 00 00 ................
.. 0x20f1980 0x20f19f0 96 00 00 00 00 00 00 00 00 c0 19 0f 02 00 00 00 00 ................
.. 0x20f19f0 0x20f1a70 112 00 00 00 00 00 00 00 00 30 1a 0f 02 00 00 00 00 ........0.......
.. 0x20f1a70 0x20f1ae0 96 00 00 00 00 00 00 00 00 b0 1a 0f 02 00 00 00 00 ................
.. 0x20f1ae0 0x20f1b50 96 00 00 00 00 00 00 00 00 20 1b 0f 02 00 00 00 00 ................
.. 0x20f1b50 0x20f1bb0 80 00 00 00 00 00 00 00 00 90 1b 0f 02 00 00 00 00 ................
.. 0x20f1bb0 0x20f1c10 80 00 00 00 00 00 00 00 00 f0 1b 0f 02 00 00 00 00 ................
.. 0x20f1c10 0x20f1c70 80 00 00 00 00 00 00 00 00 50 1c 0f 02 00 00 00 00 ........P.......
.. 0x20f1c70 0x20f1cd0 80 00 00 00 00 00 00 00 00 b0 1c 0f 02 00 00 00 00 ................
.. 0x20f1cd0 0x20f1d30 80 00 00 00 00 00 00 00 00 10 1d 0f 02 00 00 00 00 ................
.. 0x20f1d30 0x20f1d90 80 00 00 00 00 00 00 00 00 70 1d 0f 02 00 00 00 00 ........p.......
.. 0x20f1d90 0x20f1df0 80 00 00 00 00 00 00 00 00 d0 1d 0f 02 00 00 00 00 ................
.. 0x20f1df0 0x20f1e60 96 00 00 00 00 00 00 00 00 30 1e 0f 02 00 00 00 00 ........0.......
.. 0x20f1e60 0x20f1ec0 80 00 00 00 00 00 00 00 00 a0 1e 0f 02 00 00 00 00 ................
.. 0x20f1ec0 0x20f1f20 80 00 00 00 00 00 00 00 00 00 1f 0f 02 00 00 00 00 ................
.. 0x20f1f20 0x20f1f80 80 00 00 00 00 00 00 00 00 60 1f 0f 02 00 00 00 00 ........`.......
.. 0x20f1f80 0x20f1fe0 80 00 00 00 00 00 00 00 00 c0 1f 0f 02 00 00 00 00 ................
.. 0x20f1fe0 0x20f2040 80 00 00 00 00 00 00 00 00 20 20 0f 02 00 00 00 00 ................
.. 0x20f2040 0x20f20b0 96 00 00 00 00 00 00 00 00 80 20 0f 02 00 00 00 00 ................
.. 0x20f20b0 0x20f2120 96 00 00 00 00 00 00 00 00 f0 20 0f 02 00 00 00 00 ................
.. 0x20f2120 0x20f2180 80 00 00 00 00 00 00 00 00 60 21 0f 02 00 00 00 00 ........`!......
.. 0x20f2180 0x20f21e0 80 00 00 00 00 00 00 00 00 c0 21 0f 02 00 00 00 00 .........!......
.. 0x20f21e0 0x20f2230 64 00 00 00 00 00 00 00 00 20 22 0f 02 00 00 00 00 ........."......
.. 0x20f2230 0x20f2290 80 00 00 00 00 00 00 00 00 70 22 0f 02 00 00 00 00 ........p"......
.. 0x20f2290 0x20f22f0 80 00 00 00 00 00 00 00 00 d0 22 0f 02 00 00 00 00 ........."......
.. 0x20f22f0 0x20f2350 80 00 00 00 00 00 00 00 00 30 23 0f 02 00 00 00 00 ........0#......
.. 0x20f2350 0x20f3fc0 7264 58 01 0f 02 00 00 00 00 58 01 0f 02 00 00 00 00 X.......X.......
.. 0x20f3fc0 0x20f4000 48 f8 00 0f 02 00 00 00 00 f8 00 0f 02 00 00 00 00 ................
.. 0x20f4000 0x2100000 49136 00 00 00 00 00 00 00 00 00 00 00 00 00 00 00 00 ................

[1] output.E01 13:15:26> dump 0x20f1c70
Offset Hex Data
-------------- ------------------------------------------------ ----------------
0x20f1c70 63 00 6f 00 6d 00 00 00 bd 11 f0 6c 22 43 00 12 c.o.m......l"C..
0x20f1c80 00 00 00 00 00 00 00 00 b0 1c 0f 02 00 00 00 00 ................
0x20f1c90 00 00 00 00 03 00 00 00 70 31 1a 01 00 00 00 00 ........p1......
0x20f1ca0 00 00 00 00 00 00 00 00 00 00 00 00 00 00 00 00 ................
0x20f1cb0 77 00 77 00 77 00 2e 00 67 00 6f 00 6f 00 67 00 w.w.w...g.o.o.g.
0x20f1cc0 6c 00 65 00 2e 00 63 00 6f 00 6d 00 00 00 00 00 l.e...c.o.m.....
The references to the first DNS_RECORD in the linked list actually come from a different heap (Heap 12). The struct in that heap starts at 0x20f1c80 and appears to be a different struct. The pointer at offset 8 is the string, while the pointer to the DNS_RECORD is at offset 24.
What is referring to this struct?
[1] output.E01 13:17:56> grep 0x20f0000, keyword="\x80\x1c\x0f\x02"
Offset Hex Data
-------------- ------------------------------------------------------------ --------------------
0x20f14cc 00 00 00 00 00 00 00 00 00 00 00 00 00 00 00 00 00 00 00 00 ....................
0x20f14e0 80 1c 0f 02 00 00 00 00 00 00 00 00 00 00 00 00 00 00 00 00 ....................

# Go back to the start of the allocation and dump it out (This is a large
# allocation 1680 bytes):
[1] output.E01 13:21:32> dump 0x20f12f0
Offset Hex Data
-------------- ------------------------------------------------ ----------------
0x20f12f0 00 00 00 00 00 00 00 00 00 00 00 00 00 00 00 00 ................
0x20f1300 00 00 00 00 00 00 00 00 00 00 00 00 00 00 00 00 ................
0x20f1310 00 00 00 00 00 00 00 00 00 00 00 00 00 00 00 00 ................
0x20f1320 00 00 00 00 00 00 00 00 a0 1d 0f 02 00 00 00 00 ................
0x20f1330 00 00 00 00 00 00 00 00 60 1b 0f 02 00 00 00 00 ........`.......
0x20f1340 00 00 00 00 00 00 00 00 00 00 00 00 00 00 00 00 ................
0x20f1350 00 00 00 00 00 00 00 00 c0 1b 0f 02 00 00 00 00 ................
0x20f1360 00 00 00 00 00 00 00 00 00 00 00 00 00 00 00 00 ................
0x20f1370 00 00 00 00 00 00 00 00 00 00 00 00 00 00 00 00 ................
0x20f1380 00 00 00 00 00 00 00 00 30 21 0f 02 00 00 00 00 ........0!......
0x20f1390 00 00 00 00 00 00 00 00 00 00 00 00 00 00 00 00 ................
0x20f13a0 00 00 00 00 00 00 00 00 00 00 00 00 00 00 00 00 ................
0x20f13b0 00 00 00 00 00 00 00 00 00 00 00 00 00 00 00 00 ................
0x20f13c0 00 00 00 00 00 00 00 00 00 00 00 00 00 00 00 00 ................
0x20f13d0 00 00 00 00 00 00 00 00 00 00 00 00 00 00 00 00 ................
0x20f13e0 90 1f 0f 02 00 00 00 00 00 00 00 00 00 00 00 00 ................
0x20f13f0 00 00 00 00 00 00 00 00 00 00 00 00 00 00 00 00 ................
0x20f1400 00 00 00 00 00 00 00 00 00 00 00 00 00 00 00 00 ................
We see that the allocation at offset 0x20f12f0 seems to have lots of 0’s and randomly occurring pointers. If one dumps these pointers they all appear very similar to the allocation at 0x20f1c70. This looks very much like a hash table but we are not quite sure at this stage. If an application allocated this memory, it must have a pointer to it somewhere (if not the memory will be leaked!). We can search for who holds a reference to this 1680 byte allocation. The reference is not found within this heap but actually inside the mapped DLL itself (If you really have no idea where the reference might be, try vaddump to dump all the memory regions of the process and then use a hex editor to search them, alternatively you can use yarascan too):
[1] output.E01 13:28:24> grep 0x07fef9a20000, keyword="\xf0\x12\x0f\x02"
Offset Hex Data Comment
-------------- ------------------------------------------------------------ -------------------- ----------------------------------------
0x7fef9a49254 00 00 00 00 f0 24 1a 01 00 00 00 00 00 00 0f 02 00 00 00 00 .....$.............. \Windows\System32\dnsrslvr.dll+0x55DF
0x7fef9a49268 f0 12 0f 02 00 00 00 00 14 01 00 00 00 00 00 00 28 01 00 00 ................(... \Windows\System32\dnsrslvr.dll+0x55DF
Note that Rekall knows this offset falls within the mapped region of dnsrslvr.dll - in fact 0x55DF bytes into it.
I wonder if we can obtain debugging information for this dll from Microsoft?
[1] output.E01 13:34:58> peinfo 0x07fef9a20000
Attribute Value
------------------------------ ------------------------------------------------------------
Machine IMAGE_FILE_MACHINE_AMD64
TimeDateStamp 2011-03-03 06:11:04+0000
Characteristics IMAGE_FILE_DLL, IMAGE_FILE_EXECUTABLE_IMAGE,
IMAGE_FILE_LARGE_ADDRESS_AWARE
GUID/Age -
PDB -
MajorOperatingSystemVersion 6
MinorOperatingSystemVersion 1
MajorImageVersion 6
MinorImageVersion 1
MajorSubsystemVersion 6
MinorSubsystemVersion 1

Sections (Relative to 0x7FEF9A20000):
Perm Name VMA Size
---- -------- -------------- --------------
xr- .text 0x000000001000 0x00000001d400
-r- .rdata 0x00000001f000 0x000000009e00
-rw .data 0x000000029000 0x000000002600
-r- .pdata 0x00000002c000 0x000000002000
-r- .rsrc 0x00000002e000 0x000000000600
-r- .reloc 0x00000002f000 0x000000000600

Data Directories:
---------------------------------------- VMA Size
-------------- --------------
IMAGE_DIRECTORY_ENTRY_EXPORT 0x07fef9a43c2c 0x0000000000a9
IMAGE_DIRECTORY_ENTRY_IMPORT 0x07fef9a45ebc 0x000000000230
IMAGE_DIRECTORY_ENTRY_RESOURCE 0x07fef9a4e000 0x000000000528
IMAGE_DIRECTORY_ENTRY_EXCEPTION 0x07fef9a4c000 0x000000001ecc
IMAGE_DIRECTORY_ENTRY_SECURITY 0x000000000000 0x000000000000
IMAGE_DIRECTORY_ENTRY_BASERELOC 0x07fef9a4f000 0x0000000004e4
IMAGE_DIRECTORY_ENTRY_DEBUG 0x07fef9a3e31c 0x000000000038
IMAGE_DIRECTORY_ENTRY_COPYRIGHT 0x000000000000 0x000000000000
IMAGE_DIRECTORY_ENTRY_GLOBALPTR 0x000000000000 0x000000000000
IMAGE_DIRECTORY_ENTRY_TLS 0x000000000000 0x000000000000
IMAGE_DIRECTORY_ENTRY_LOAD_CONFIG 0x000000000000 0x000000000000
IMAGE_DIRECTORY_ENTRY_BOUND_IMPORT 0x07fef9a202d8 0x00000000041c
IMAGE_DIRECTORY_ENTRY_IAT 0x07fef9a3f000 0x000000000788
IMAGE_DIRECTORY_ENTRY_DELAY_IMPORT 0x07fef9a45d2c 0x000000000080
IMAGE_DIRECTORY_ENTRY_COM_DESCRIPTOR 0x000000000000 0x000000000000
IMAGE_DIRECTORY_ENTRY_RESERVED 0x000000000000 0x000000000000

Import Directory (Original):
Name Mapped Function Ord
-------------------------------------------------- ------------------------------------------------------------ -----

Export Directory:
Entry Stat Ord Name
-------------- ---- ----- ----
0x07fef9a2bf14 M 0 dnsrslvr.dll!LoadGPExtension (dnsrslvr!LoadGPExtension)
0x07fef9a28350 M 1 dnsrslvr.dll!Reg_DoRegisterAdapter (dnsrslvr!Reg_DoRegisterAdapter)
0x07fef9a2c5f8 M 2 dnsrslvr.dll!ServiceMain (dnsrslvr!ServiceMain)
0x07fef9a2c5e8 M 3 dnsrslvr.dll!SvchostPushServiceGlobals (dnsrslvr!SvchostPushServiceGlobals)
0x07fef9a43c89 M 4 dnsrslvr.dll! (\Windows\System32\dnsrslvr.dll)
Version Information:
key value
-------------------- -----
Unfortunately in this case the RSDS section is not mapped in. We will have to read it from the file on disk:
[1] pmem 12:17:18> peinfo executable="c:/Windows/System32/dnsrslvr.dll"
Attribute Value
-------------------- --------------------------------------------------------
Machine IMAGE_FILE_MACHINE_AMD64
TimeDateStamp 2011-03-03 06:11:04+0000
Characteristics IMAGE_FILE_DLL, IMAGE_FILE_EXECUTABLE_IMAGE,
IMAGE_FILE_LARGE_ADDRESS_AWARE
GUID/Age D5736592F1A64779989D409FCC6BA4952
PDB dnsrslvr.pdb
.....
We can download an parse the PDB for this dll:
[1] output.E01 13:38:32> fetch_pdb guid="D5736592F1A64779989D409FCC6BA4952", pdb_filename="dnsrslvr.pdb"
Trying to fetch http://msdl.microsoft.com/download/symbols/dnsrslvr.pdb/D5736592F1A64779989D409FCC6BA4952/dnsrslvr.pd_

[1] output.E01 13:39:02> parse_pdb "dnsrslvr.pdb", output="/tmp/dnsrslvr.json"
Unfortunately the public symbol server does not have information for structs, but it does have information for global constants. We can search for the name of the constant at offset 0x7fef9a49268 (168552 relative to the start of the PE image). We see that this symbol is in fact the hash table:
"g_HashTable": 168552,
"g_HashTableSize": 168304,
The other interesting thing we notice is that most of the allocations in heap 12 seems to be related to the hash table and its records. In fact it appears as though the entire heap is dedicated to the DNS resolver itself. We can check this by searching for a reference to the heap from the DLL:
[1] output.E01 14:52:07> grep 0x07fef9a20000, keyword="\x00\x00\x0f\x02\x00\x00"
Offset Hex Data Comment
-------------- ------------------------------------------------------------ -------------------- ----------------------------------------
0x7fef9a4924c 00 00 00 00 ac 02 00 00 00 00 00 00 f0 24 1a 01 00 00 00 00 .............$...... \Windows\System32\dnsrslvr.dll+0x55D7
0x7fef9a49260 00 00 0f 02 00 00 00 00 f0 12 0f 02 00 00 00 00 14 01 00 00 .................... \Windows\System32\dnsrslvr.dll+0x55D7
[1] output.E01 14:52:34> 0x7fef9a49260 - 0x07fef9a20000
Out > 168544
[1] output.E01 14:53:08> !grep 168544 /tmp/dnsrslvr.json
"g_CacheHeap": 168544,

3.1. Putting it all together

So now we can summarize how the DNS cache looks:
  1. There is a global symbol in dnsrslvr.dll pointing to a private heap (named g_CacheHeap).
  2. The heap has a allocation for a hash table. The allocation contains pointers to DNS_HASHTABLE_ENTRY records.
  3. Each DNS_HASHTABLE_ENTRY has a reference to a head of a singly linked list of DNS_RECORD structs relating to the name.
  4. Each DNS_RECORD struct contains either an A record (IP Address) or a CNAME record anther name.
We can now put it all together in a plugin:
[1] output.E01 14:54:08> dns_cache
DEBUG:root:Switching to process context: svchost.exe (Pid 1076@0xfa800271c630)
INFO:root:Loaded profile ntdll/GUID/9D04EB0AA387494FBD81ED062072B99C2 from Directory:/home/scudette/projects/rekall-profiles/v1.0
Name Record Type Data
--------------------------------------------- -------------- ------ ----
clients4.google.com 0x0000020f1da0 HTABLE
. clients4.google.com 0x0000011a2b40 CNAME clients.l.google.com
. clients.l.google.com 0x0000011a2c00 A 64.233.187.102
. clients.l.google.com 0x0000011c35d0 A 64.233.187.139
. clients.l.google.com 0x0000011c3610 A 64.233.187.100
. clients.l.google.com 0x0000011c3650 A 64.233.187.101
tools.google.com 0x0000020f1b60 HTABLE
crl.microsoft.com 0x0000020f1bc0 HTABLE
code.jquery.com 0x0000020f2130 HTABLE
. code.jquery.com 0x0000011f56a0 CNAME code.jquery.netdna-cdn.com
. code.jquery.netdna-cdn.com 0x0000011c3840 A 94.31.29.53
. code.jquery.netdna-cdn.com 0x0000011c38d0 A 94.31.29.230
apis.google.com 0x0000020f1f90 HTABLE
. apis.google.com 0x0000011f5950 CNAME plus.l.google.com
. plus.l.google.com 0x0000011f59d0 A 173.194.72.101
. plus.l.google.com 0x0000011f5a50 A 173.194.72.113
. plus.l.google.com 0x0000011f5a90 A 173.194.72.138
. plus.l.google.com 0x0000011f5ad0 A 173.194.72.102
www.google.com 0x0000020f1c80 HTABLE
. www.google.com 0x0000011a3170 A 173.194.72.147
. www.google.com 0x0000011a31e0 A 173.194.72.99
. www.google.com 0x0000011c3be0 A 173.194.72.104
. www.google.com 0x0000011c3c20 A 173.194.72.106
en.wikipedia.org 0x0000020f2190 HTABLE
. en.wikipedia.org 0x0000011f6570 A 198.35.26.96
fe2.update.microsoft.com 0x0000020f1af0 HTABLE
www.rekall-forensic.com 0x0000020f2050 HTABLE
. www.rekall-forensic.com 0x0000011f5c50 CNAME github.map.fastly.net
. github.map.fastly.net 0x0000011f5d10 CNAME google.github.io
. google.github.io 0x0000011f5dd0 A 103.245.222.133
mscrl.microsoft.com 0x0000020f1c20 HTABLE
github.com 0x0000020f21f0 HTABLE
. github.com 0x0000011f6950 A 192.30.252.129
clients1.google.com 0x0000020f2300 HTABLE
. clients1.google.com 0x0000011a2f60 CNAME clients.l.google.com
. clients.l.google.com 0x0000011a3020 A 173.194.72.101
. clients.l.google.com 0x0000011a30a0 A 173.194.72.100
. clients.l.google.com 0x0000011a30e0 A 173.194.72.102
. clients.l.google.com 0x0000011f5fd0 A 173.194.72.139
www.google.de 0x0000020f1d40 HTABLE
. www.google.de 0x0000011f55f0 A 216.58.220.99
translate.googleapis.com 0x0000020f1e00 HTABLE
. translate.googleapis.com 0x0000011a3130 CNAME googleapis.l.google.com
. googleapis.l.google.com 0x0000011c3690 A 74.125.204.95
ctldl.windowsupdate.com 0x0000020f1990 HTABLE
www.python.org 0x0000020f22a0 HTABLE
. www.python.org 0x0000011a29e0 CNAME python.map.fastly.net
. python.map.fastly.net 0x0000011f6bb0 A 103.245.222.223
plusvic.github.io 0x0000020f2240 HTABLE
. plusvic.github.io 0x0000011f6a70 CNAME github.map.fastly.net
. github.map.fastly.net 0x0000011f6b30 A 103.245.222.133
www.gstatic.com 0x0000020f1ed0 HTABLE
. www.gstatic.com 0x0000011c3f40 A 173.194.72.94
. www.gstatic.com 0x0000011f5710 A 173.194.72.120
rekall-forensic.com 0x0000020f1ff0 HTABLE
. rekall-forensic.com 0x0000011f5b10 A 216.239.32.21
. rekall-forensic.com 0x0000011f5b90 A 216.239.34.21
. rekall-forensic.com 0x0000011f5bd0 A 216.239.36.21
. rekall-forensic.com 0x0000011f5c10 A 216.239.38.21
download.microsoft.com 0x0000020f1a80 HTABLE
ds.download.windowsupdate.com 0x0000020f1a00 HTABLE
netdna.bootstrapcdn.com 0x0000020f20c0 HTABLE
. netdna.bootstrapcdn.com 0x0000011f5e50 CNAME bootstrapcdn.jdorfman.netdna-cdn.com
. bootstrapcdn.jdorfman.netdna-cdn.com 0x0000011f5f30 A 94.31.29.154
clients3.google.com 0x0000020f1f30 HTABLE
. clients3.google.com 0x0000011f5750 CNAME clients.l.google.com
. clients.l.google.com 0x0000011f5810 A 173.194.72.139
. clients.l.google.com 0x0000011f5890 A 173.194.72.101
. clients.l.google.com 0x0000011f58d0 A 173.194.72.138
. clients.l.google.com 0x0000011f5910 A 173.194.72.100
ssl.gstatic.com 0x0000020f1e70 HTABLE
. ssl.gstatic.com 0x0000011c3940 A 173.194.72.94
. ssl.gstatic.com 0x0000011c39b0 A 173.194.72.120
www.microsoft.com 0x0000020f1ce0 HTABLE
. www.microsoft.com 0x0000011c3a10 CNAME e10088.dscb.akamaiedge.net
. e10088.dscb.akamaiedge.net 0x0000011c3ae0 CNAME toggle.www.ms.akadns.net
. toggle.www.ms.akadns.net 0x0000011c3c60 CNAME www.microsoft.com.edgekey.net
. www.microsoft.com.edgekey.net 0x0000011c3d40 A 23.53.152.151
- 0x434e6df011bc HTABLE

Rekall NTFS Support.

$
0
0
Why did we add NTFS support to a memory forensic tool? 
  1. When we added support for using the windows pagefile to supplement memory analysis it became apparent that we needed to read the pagefile directly from the NTFS since the file is normally locked - so normal file APIs are not usable. We considered using tricky kernel hacking to bypass the file lock restrictions but this seems fragile and NTFS parsing is not that complicated. For memory acquisition using WinPmem we included the fcat tool from the Sleuthkit to copy the pagefile out (alternatively we could have linked libtsk directly). But one of the more important uses of Rekall is live analysis, and this does not really solve it.
  2. We knew that Rekall’s binary parsing library was up to the task of handling NTFS. It was a good exercise to learn NTFS and document it in the Rekall implementation. I used Brian Carrier’s excellent book File System Forensic Analysis to learn about the NTFS and implement it in Rekall.
  3. Although we also maintain pytsk as a python binding to the TSK library, it is a bit of a pain to use. The bindings are sometimes fragile and can cause crashes under some situations. They also need to be frequently updated when TSK evolves. Performance is not great - TSK needs to parse the entire MFT each time it is loaded. Pytsk has a lot of trouble parsing a live filesystems since TSK caches its analysis of the MFT and might not see new files created after this initial MFT parsing. Rebuilding the caches is quite slow too due to the IO required in reading the entire MFT each time. I felt that a pure python implementation of NTFS parsing can be useful in some situations and use cases and possibly be more efficient (Despite being written in Python :-).
  4. Probably the most important reason for implementing NTFS parsing in Rekall was that it was a hell of a lot of fun! Rekall’s programming APIs are very easy to work with and the final plugins were really fast and powerful.
Rekall’s implementation is not supposed to be a replacement for TSK. The Sleuthkit actually converts much of the information found in NTFS into a common format to fit all filesystems. So for example, it extends the inode abstraction from other filesystems from a simple integer to a string which may contain type and id (e.g. 50-144-8). Some of the timestamps are also omitted from the tool’s output (but may be found using the low level API). This extra layer of abstraction is good in the general case (e.g. autopsy works with all filesystems in the same way) but may actually be hiding some important forensic information in some cases. Its useful to have an implementation of NTFS parsing with no abstractions at all - to allow examiners to corroborate some of the low level information available.

1. Rekall NTFS plugins.

In order to analyze an NTFS disk image, simply load it with the familiar -f switch. In the following example I use the vdfuse tool in order to export my Virtual Box VDI disk partitions as raw devices:
$ vdfuse -r -f ~/VirtualBox\ VMs/win7/win7.vdi /tmp/mnt/
$ rekal -f /tmp/mnt/Partition2
--------------------------------------------------------------------------
The Rekall Memory Forensic framework 1.2.0 (Col de la Croix).

"We can remember it for you wholesale!"

This program is free software; you can redistribute it and/or modify it under
the terms of the GNU General Public License.

See http://www.rekall-forensic.com/docs/Manual/tutorial.html to get started.
--------------------------------------------------------------------------
[1] Partition2 15:57:14> istat
MFT Entry Header Values:
Entry: 5 Sequence: 5
$LogFile Sequence Number: 13730649171
Links: 1

$STANDARD_INFORMATION Attribute Values:
Flags COMPRESSED, HIDDEN, SYSTEM
Owner ID 0
SID 265
Created 2009-07-14 02:38:56+0000
File Modified 2014-10-31 21:36:56+0000
MFT Modified 2014-10-31 21:36:56+0000
Accessed 2014-10-31 21:36:56+0000

Attributes:
Inode Type Name Res Size Comment
--------------- ------------------------------ ---------- ----- ---------- -------
5-16-0 $STANDARD_INFORMATION True 72
5-48-1 $FILE_NAME True 68 .
5-144-6 $INDEX_ROOT $I30 True 168
5-160-8 $INDEX_ALLOCATION $I30 False 8192
5-176-7 $BITMAP $I30 True 8
5-256-9 $LOGGED_UTILITY_STREAM $TXF_DATA True 56

$I30 Analysis:
MFT Seq Created File Mod MFT Mod Access Size Filename
---------- ----- ------------------------- ------------------------- ------------------------- ------------------------- ---------- --------
4 4 - - - - 0 $AttrDef
8 8 - - - - 0 $BadClus
6 6 - - - - 0 $Bitmap
7 7 - - - - 0 $Boot
11 11 2013-02-20 02:35:15+0000 2013-02-20 02:35:15+0000 2013-02-20 02:35:15+0000 2013-02-20 02:35:15+0000 0 $Extend
2 2 - - - - 0 $LogFile
0 1 2013-02-20 02:35:15+0000 2013-02-20 02:35:15+0000 2013-02-20 02:35:15+0000 2013-02-20 02:35:15+0000 16384 $MFT
1 1 - - - - 0 $MFTMirr
57 3 2009-07-14 03:18:56+0000 2013-02-19 17:51:59+0000 2013-02-19 17:51:59+0000 2013-02-19 17:51:59+0000 0 $Recycle.Bin
9 9 2013-02-20 02:35:15+0000 2013-02-20 02:35:15+0000 2013-02-20 02:35:15+0000 2013-02-20 02:35:15+0000 0 $Secure
10 10 - - - - 0 $UpCase
3 3 - - - - 0 $Volume
5 5 2009-07-14 02:38:56+0000 2014-10-31 21:36:56+0000 2014-10-31 21:36:56+0000 2014-10-31 21:36:56+0000 0 .
145393 16 2013-02-24 22:22:28+0000 2014-10-28 09:15:59+0000 2014-10-28 09:15:59+0000 2014-10-28 09:15:59+0000 0 Config.Msi
63072 11 2013-02-19 18:31:29+0000 2014-10-23 15:24:31+0000 2014-10-23 15:24:31+0000 2014-10-23 15:24:31+0000 0 cygwin
13692 1 2009-07-14 05:08:56+0000 2009-07-14 05:08:56+0000 2013-02-20 02:46:34+0000 2009-07-14 05:08:56+0000 0 Documents and Settings
165336 45 2013-12-28 19:17:49+0000 2013-12-28 19:17:55+0000 2013-12-28 19:17:55+0000 2013-12-28 19:17:55+0000 0 MinGW
1251 15 2014-08-25 13:45:38+0000 2014-10-27 14:08:43+0000 2014-10-27 14:08:43+0000 2014-08-25 13:45:38+0000 1207721984 pagefile.sys
58 1 2009-07-14 03:20:08+0000 2009-07-14 03:20:08+0000 2013-02-20 02:46:13+0000 2009-07-14 03:20:08+0000 0 PerfLogs
60 1 2009-07-14 03:20:08+0000 2014-08-27 23:30:42+0000 2014-08-27 23:30:42+0000 2014-08-27 23:30:42+0000 0 Program Files
247 1 2009-07-14 03:20:08+0000 2014-10-28 09:11:38+0000 2014-10-28 09:11:38+0000 2014-10-28 09:11:38+0000 0 Program Files (x86)
363 1 2009-07-14 03:20:08+0000 2013-02-19 18:27:21+0000 2013-02-19 18:27:21+0000 2013-02-19 18:27:21+0000 0 ProgramData
60 1 2009-07-14 03:20:08+0000 2014-08-27 23:30:42+0000 2014-08-27 23:30:42+0000 2014-08-27 23:30:42+0000 0 PROGRA~1
247 1 2009-07-14 03:20:08+0000 2014-10-28 09:11:38+0000 2014-10-28 09:11:38+0000 2014-10-28 09:11:38+0000 0 PROGRA~2
363 1 2009-07-14 03:20:08+0000 2013-02-19 18:27:21+0000 2013-02-19 18:27:21+0000 2013-02-19 18:27:21+0000 0 PROGRA~3
88993 1 2013-02-19 18:58:43+0000 2014-08-27 22:34:33+0000 2014-10-21 16:39:13+0000 2014-08-27 22:34:33+0000 0 Python27
118195 3 2013-02-19 22:37:36+0000 2013-05-30 13:28:51+0000 2013-05-30 13:28:51+0000 2013-05-30 13:28:51+0000 0 Python27.32
27376 2 2013-02-19 17:51:27+0000 2013-02-19 17:51:27+0000 2013-02-19 17:51:27+0000 2013-02-19 17:51:27+0000 0 Recovery
149334 13 2014-08-06 18:56:26+0000 2014-09-11 14:18:27+0000 2014-09-11 14:18:27+0000 2014-09-11 14:18:27+0000 0 rekall-profiles
149334 13 2014-08-06 18:56:26+0000 2014-09-11 14:18:27+0000 2014-09-11 14:18:27+0000 2014-09-11 14:18:27+0000 0 REKALL~1
16393 2 2013-02-20 02:47:16+0000 2014-10-31 22:07:56+0000 2014-10-31 22:07:56+0000 2014-10-31 22:07:56+0000 0 System Volume Information
16393 2 2013-02-20 02:47:16+0000 2014-10-31 22:07:56+0000 2014-10-31 22:07:56+0000 2014-10-31 22:07:56+0000 0 SYSTEM~1
457 1 2009-07-14 03:20:08+0000 2013-02-19 17:51:39+0000 2014-08-27 22:06:23+0000 2013-02-19 17:51:39+0000 0 Users
154403 2 2013-02-20 13:12:13+0000 2013-02-20 13:15:48+0000 2013-02-20 13:15:48+0000 2013-02-20 13:15:48+0000 0 websymbols
154403 2 2013-02-20 13:12:13+0000 2013-02-20 13:15:48+0000 2013-02-20 13:15:48+0000 2013-02-20 13:15:48+0000 0 WEBSYM~1
58269 7 2013-02-19 18:28:16+0000 2013-02-19 18:28:16+0000 2013-02-19 18:28:16+0000 2013-02-19 18:28:16+0000 0 WinDDK
619 1 2009-07-14 03:20:08+0000 2014-10-21 23:41:52+0000 2014-10-21 23:41:52+0000 2014-10-21 23:41:52+0000 0 Windows
The istat plugin displays information about a particular MFT entry. By default it shows entry 5 (The root directory). If the entry has an I30 attribute (which represents a directory index) the plugin further parses the entry and displays all files in the directory recovered from the I30 attribute stream. Note that the I30 stream contains 3 timestamps for each entry which are separated from the timestamps actually present in the MFT’s $STANDARD_INFORMATION attribute.
The output of istat also lists the attributes and their types in a similar notation to that found in, e.g. the Sleuthkit. That is as a tuple separated by dashes, MFT-TYPE-ID.
The fls plugin works in a similar way, but lists directories based on a filename, rooted at the root of the filesystem. The filename may use forward or backslash for separators.
[1] Partition2 16:06:52> fls "Python27"
-----------------------> fls("Python27")
MFT Seq Created File Mod MFT Mod Access Size Filename
---------- ----- ------------------------- ------------------------- ------------------------- ------------------------- ---------- --------
213703 19 2013-12-28 19:37:46+0000 2013-12-28 19:37:47+0000 2013-12-28 19:37:47+0000 2013-12-28 19:37:46+0000 1315 distorm3-wininst.log
213703 19 2013-12-28 19:37:46+0000 2013-12-28 19:37:47+0000 2013-12-28 19:37:47+0000 2013-12-28 19:37:46+0000 1315 DISTOR~1.LOG
91798 1 2013-02-19 18:59:11+0000 2013-12-28 17:23:18+0000 2013-12-28 17:23:18+0000 2013-12-28 17:23:18+0000 0 DLLs
94581 1 2013-02-19 18:59:34+0000 2013-02-19 18:59:34+0000 2013-02-19 18:59:34+0000 2013-02-19 18:59:34+0000 0 Doc
92031 1 2013-02-19 18:59:15+0000 2014-10-03 00:01:56+0000 2014-10-03 00:01:56+0000 2014-10-03 00:01:56+0000 0 include
89201 1 2013-02-19 18:58:47+0000 2014-10-31 21:17:03+0000 2014-10-31 21:17:03+0000 2014-10-31 21:17:03+0000 0 Lib
92334 1 2013-02-19 18:59:18+0000 2013-02-19 18:59:18+0000 2013-02-19 18:59:18+0000 2013-02-19 18:59:18+0000 0 libs
89063 1 2012-04-10 22:31:16+0000 2012-04-10 22:31:16+0000 2013-02-19 18:58:44+0000 2013-02-19 18:58:44+0000 40092 LICENSE.txt
127389 7 2013-05-30 13:01:27+0000 2013-05-30 13:01:29+0000 2013-05-30 13:01:29+0000 2013-05-30 13:01:27+0000 9973 M2Crypto-wininst.log
127389 7 2013-05-30 13:01:27+0000 2013-05-30 13:01:29+0000 2013-05-30 13:01:29+0000 2013-05-30 13:01:27+0000 9973 M2CRYP~1.LOG
89035 1 2012-04-10 22:18:52+0000 2012-04-10 22:18:52+0000 2013-02-19 18:58:44+0000 2013-02-19 18:58:44+0000 310875 NEWS.txt
129217 7 2013-05-30 13:02:47+0000 2013-05-30 13:02:47+0000 2013-05-30 13:02:47+0000 2013-05-30 13:02:47+0000 2645 psutil-wininst.log
129217 7 2013-05-30 13:02:47+0000 2013-05-30 13:02:47+0000 2013-05-30 13:02:47+0000 2013-05-30 13:02:47+0000 2645 PSUTIL~1.LOG
1267 8 2014-08-27 22:34:33+0000 2014-08-27 22:34:36+0000 2014-08-27 22:34:36+0000 2014-08-27 22:34:36+0000 0 PyInstaller-2.1
1267 8 2014-08-27 22:34:33+0000 2014-08-27 22:34:36+0000 2014-08-27 22:34:36+0000 2014-08-27 22:34:36+0000 0 PYINST~1.1
89064 1 2012-04-10 22:24:54+0000 2012-04-10 22:24:54+0000 2013-02-19 18:58:44+0000 2013-02-19 18:58:44+0000 27136 python.exe
89065 1 2012-04-10 22:24:58+0000 2012-04-10 22:24:58+0000 2013-02-19 18:58:44+0000 2013-02-19 18:58:44+0000 27648 pythonw.exe
116396 2 2013-02-19 19:45:14+0000 2013-02-19 23:42:49+0000 2013-02-19 23:42:49+0000 2013-02-19 19:45:14+0000 238566 pywin32-wininst.log
116396 2 2013-02-19 19:45:14+0000 2013-02-19 23:42:49+0000 2013-02-19 23:42:49+0000 2013-02-19 19:45:14+0000 238566 PYWIN3~1.LOG
89009 2 2012-03-18 22:58:32+0000 2013-05-30 13:36:32+0000 2013-05-30 13:36:32+0000 2013-05-30 13:36:32+0000 2797 readme.txt
213706 13 2013-12-28 19:37:46+0000 2013-12-28 19:37:46+0000 2013-12-28 19:37:46+0000 2013-12-28 19:37:46+0000 223744 Removedistorm3.exe
127390 5 2013-05-30 13:01:27+0000 2013-05-30 13:01:27+0000 2013-05-30 13:01:27+0000 2013-05-30 13:01:27+0000 223744 RemoveM2Crypto.exe
129218 5 2013-05-30 13:02:47+0000 2013-05-30 13:02:47+0000 2013-05-30 13:02:47+0000 2013-05-30 13:02:47+0000 223744 Removepsutil.exe
116397 2 2013-02-19 19:45:14+0000 2013-02-19 23:42:21+0000 2013-02-19 23:42:21+0000 2013-02-19 19:45:14+0000 223744 Removepywin32.exe
116397 2 2013-02-19 19:45:14+0000 2013-02-19 23:42:21+0000 2013-02-19 23:42:21+0000 2013-02-19 19:45:14+0000 223744 REMOVE~1.EXE
127390 5 2013-05-30 13:01:27+0000 2013-05-30 13:01:27+0000 2013-05-30 13:01:27+0000 2013-05-30 13:01:27+0000 223744 REMOVE~2.EXE
129218 5 2013-05-30 13:02:47+0000 2013-05-30 13:02:47+0000 2013-05-30 13:02:47+0000 2013-05-30 13:02:47+0000 223744 REMOVE~3.EXE
213706 13 2013-12-28 19:37:46+0000 2013-12-28 19:37:46+0000 2013-12-28 19:37:46+0000 2013-12-28 19:37:46+0000 223744 REMOVE~4.EXE
117061 1 2013-02-19 19:45:15+0000 2014-08-27 23:48:19+0000 2014-08-27 23:48:19+0000 2014-08-27 23:48:19+0000 0 Scripts
233676 26 2014-02-19 22:43:58+0000 2014-02-19 22:43:58+0000 2014-02-19 22:43:58+0000 2014-02-19 22:43:58+0000 0 share
92364 1 2013-02-19 18:59:18+0000 2013-02-19 18:59:33+0000 2013-02-19 18:59:33+0000 2013-02-19 18:59:33+0000 0 tcl
94437 1 2013-02-19 18:59:33+0000 2013-02-19 18:59:34+0000 2013-02-19 18:59:34+0000 2013-02-19 18:59:34+0000 0 Tools
Similarly fstat is analogous to istat except takes a filename as an argument.
Rekall supports NTFS compressed files too. Consider the following file:
[1] Partition2 16:06:54> istat 89063
MFT Entry Header Values:
Entry: 89063 Sequence: 1
$LogFile Sequence Number: 12520239903
Links: 1

$STANDARD_INFORMATION Attribute Values:
Flags ARCHIVE, COMPRESSED
Owner ID 0
SID 713
Created 2012-04-10 22:31:16+0000
File Modified 2012-04-10 22:31:16+0000
MFT Modified 2013-02-19 18:58:44+0000
Accessed 2013-02-19 18:58:44+0000

Attributes:
Inode Type Name Res Size Comment
--------------- ------------------------------ ---------- ----- ---------- -------
89063-16-0 $STANDARD_INFORMATION True 72
89063-48-2 $FILE_NAME True 88 LICENSE.txt
89063-128-3 $DATA False 40092 VCN: 0-15

Clusters (128-3):
3456320-3456326(6) Sparse(10)
NTFS compression works by compressing every 16 clusters together, and inserting a sparse cluster to cover the compressed region. We can see this in the above cluster listing.
Rekall provides the idump plugin which is analogous to the regular dump plugin, and displays a hexdump of the MTF entry.
[1] Partition2 16:06:56> idump 89063
Offset Hex Data
-------------- ------------------------------------------------ ----------------
0x0 41 2e 20 48 49 53 54 4f 52 59 20 4f 46 20 54 48 A..HISTORY.OF.TH -
0x10 45 20 53 4f 46 54 57 41 52 45 0d 0a 3d 3d 3d 3d E.SOFTWARE..==== -
0x20 3d 3d 3d 3d 3d 3d 3d 3d 3d 3d 3d 3d 3d 3d 3d 3d ================ -
0x30 3d 3d 3d 3d 3d 3d 0d 0a 0d 0a 50 79 74 68 6f 6e ======....Python -
0x40 20 77 61 73 20 63 72 65 61 74 65 64 20 69 6e 20 .was.created.in. -
0x50 74 68 65 20 65 61 72 6c 79 20 31 39 39 30 73 20 the.early.1990s. -
0x60 62 79 20 47 75 69 64 6f 20 76 61 6e 20 52 6f 73 by.Guido.van.Ros -
0x70 73 75 6d 20 61 74 20 53 74 69 63 68 74 69 6e 67 sum.at.Stichting -
0x80 0d 0a 4d 61 74 68 65 6d 61 74 69 73 63 68 20 43 ..Mathematisch.C -
0x90 65 6e 74 72 75 6d 20 28 43 57 49 2c 20 73 65 65 entrum.(CWI,.see -
If you want to copy a file out of the NTFS filesystem, use the iexport plugin.
[1] Partition2 16:50:46> iexport 89063, dump_dir="/tmp/"
Writing MFT Entry 89063 as Python27/LICENSE.txt
[1] Partition2 16:51:11> !head /tmp/Python27%2fLICENSE.txt
A. HISTORY OF THE SOFTWARE
==========================

Python was created in the early 1990s by Guido van Rossum at Stichting
Mathematisch Centrum (CWI, see http://www.cwi.nl) in the Netherlands
as a successor of a language called ABC. Guido remains Python's
principal author, although it includes many contributions from others.

In 1995, Guido continued his work on Python at the Corporation for
National Research Initiatives (CNRI, see http://www.cnri.reston.va.us)

2. Rekall’s NTFS implementation notes.

This section is intended for Rekall developers who want to learn a bit about how Rekall’s NTFS implementation uses some of the common features in the Rekall API.

2.1. Autodetection of NTFS

To make Rekall as easy to use as possible, we use autodetection as much as we can. Ideally a user should simply provide the image file, and Rekall will detect the image format and the profile required. To support this, Rekall has an autodetection plugin system. A detector class simply registers by extending guess_profile.DetectionMethod:
classNTFSDetector(guess_profile.DetectionMethod):
name ="ntfs"

defOffsets(self):
return[0]

defDetectFromHit(self, hit, _, address_space):
ntfs_profile = self.session.LoadProfile("ntfs")
try:
ntfs =NTFS(address_space=address_space, session=self.session)
self.session.SetParameter("ntfs", ntfs)

return ntfs_profile
except NTFSParseError:
return
The detector can provide a string on which to fire, or a list of offsets to check in its Offsets() method. The framework will then call it when a hit is found.

2.2. Implementing Fixups

One of the more interesting features of NTFS is the use of Fixups. When the NTFS writes to disk certain data structures, it replaces some bytes in the cluster with a random sequence. It then stores the bytes that used to be there as fixups in a list. When NTFS reads the cluster from disk it applies the fixups to get the original data.
This means that we can not simply read clusters from the disk - we must apply the relevant fixups. In Rekall we have an Address Space abstraction to read data. Address Spaces typically layer on top of other address spaces. Hence we can implement the FixupAddressSpace so it can be layered on top of another address space:
classFixupAddressSpace(addrspace.BaseAddressSpace):
"""An address space to implement record fixup."""

def__init__(self, fixup_magic, fixup_table, base_offset, length,**kwargs):
super(FixupAddressSpace, self).__init__(**kwargs)
self.as_assert(self.base isnot None,"Address space must be stacked.")
self.base_offset = base_offset
self.fixup_table = fixup_table
self.fixup_magic = fixup_magic

# We read the entire region into a mutable buffer then apply the fixups.
self.buffer = array.array("c", self.base.read(base_offset, length))
for i, fixup_value inenumerate(fixup_table):
fixup_offset =(i+1)*512-2
if(self.buffer[fixup_offset:fixup_offset+2].tostring()!=
fixup_magic.v()):
raiseNTFSParseError("Fixup error")

self.buffer[fixup_offset:fixup_offset+2]= array.array(
"c", fixup_value.v())

defread(self, address, length):
buffer_offset = address - self.base_offset
return self.buffer[buffer_offset:buffer_offset+length].tostring()
We can then apply the fixup to arbitary structures. The below code will automatically apply the fixup every time we instantiate an MFT_ENTRY struct. Therefore the fixups become completely transparent now:
classMFT_ENTRY(obj.Struct):
def__init__(self,**kwargs):
super(MFT_ENTRY, self).__init__(**kwargs)

# We implement fixup by wrapping the base address space with a fixed
# one:
self.obj_vm =FixupAddressSpace(fixup_magic=self.fixup_magic,
fixup_table=self.fixup_table,
base_offset=self.obj_offset,
length=self.mft_entry_allocated,
base=self.obj_vm)

2.3. Runlists

NTFS attributes can be fragmented. The actual blocks they occupy on disk are described using a run list. Rekall already has an address space primitive called a RunBasedAddressSpace. This type of address space is simply initialized with a list of runs specifying tuples of the form (file address, disk address length), and then layered on top of the Physical Address Space (i.e. the disk image).
Supporting compressed files makes the implementation slightly more complex, but in general all one has to do is derive an address space from the RunBasedAddressSpace and in the constructor populate the self.runs collection. The following shows the simplified implementation ignoring compression.
classRunListAddressSpace(addrspace.RunBasedAddressSpace):
"""An address space which is initialized from a runlist."""

def__init__(self, run_list, cluster_size=None, size=0,**kwargs):
super(RunListAddressSpace, self).__init__(**kwargs)
self.PAGE_SIZE = cluster_size or self.session.cluster_size
self.compression_unit_size =16* self.PAGE_SIZE
self._end = size

# In clusters.
file_offset =0
for range_start, range_length in run_list:
self._store_run(
file_offset, range_start, uncompressed_range_length)

def_store_run(self, file_offset, range_start, length):
"""Store a new run with all items given in self.PAGE_SIZE."""
self.runs.insert(
[file_offset * self.PAGE_SIZE,
range_start * self.PAGE_SIZE,
length * self.PAGE_SIZE,
False])
...
Once the mapping is defined, the address space takes care of efficiently locating and using the correct run for arbitrary read operations.

2.4. Further abstractions

Rekall uses rekall.obj.Struct classes to represent arbitrary structs in memory. There is a mechanism to extend these and provide methods for these structs. The methods can be used to define a kind of API for accessing other data. For example, we can attach convenience methods to an MFT_ENTRY:
classMFT_ENTRY(obj.Struct):

@property
defattributes(self):
"""Iterate over all attributes, even ones in $ATTRIBUTE_LIST."""
seen =set()

for attribute in self._attributes:
if attribute.type ==0xFFFFFFFF:
break

if attribute in seen:
continue

seen.add(attribute)
yield attribute

if attribute.type =="$ATTRIBUTE_LIST":
for sub_attr in attribute.DecodeAttribute():
if sub_attr.mftReference == self.mft_entry:
continue

result = sub_attr.attribute
if result in seen:
continue

yield result

defopen_file(self):
"""Returns an address space which maps the content of the file's data.

If this MFT does not contain any $DATA streams, returns a NoneObject().

The returned address space is formed by joining all $DATA streams' run
lists in this MFT into a contiguous mapping.
"""
....

deflist_files(self):
"""List the files contained in this directory.

Note that any file can contain other files (i.e. be a directory) if it
has an $I30 stream. Thats is directories may also contain data and
behave as files!

Returns:
An iterator over all INDEX_RECORD_ENTRY.
"""
....
The above is a sample of some of the convenience methods attached to the MFT_ENTRY. The first combines the attributes defined within the MFT with those defined inside the $ATTRIBUTE_LISTattribute (Typically an MFT will start with some built in attributes until it runs out of room, then it will move some attributes to an $ATTRIBUTE_LIST attribute which is non resident. But this is an implementation detail of the MFT and should really be abstracted.
Similarly we have the list_files() method which simply finds the $INDEX_ROOT and $INDEX_ALLOCATION attributes and enumerates all entries within.
Similarly file data can be stored in multiple $DATA attributes (with different VCN ranges). Its a bit tedious to combine these $DATA attributes and so we have the open_file() convenience method to return a suitable address space over the file.

3. Using the NTFS API.

Using these method it is easy to use the API to open and read arbitrary MFT entries:
$ rekal -f /tmp/mnt/Partition2
----------------------------------------------------------------------------
The Rekall Memory Forensic framework 1.2.0 (Col de la Croix).

"We can remember it for you wholesale!"

This program is free software; you can redistribute it and/or modify it under
the terms of the GNU General Public License.

See http://www.rekall-forensic.com/docs/Manual/tutorial.html to get started.
----------------------------------------------------------------------------
# This gets a reference to the ntfs object which represents the filesystem.
[1] Partition2 19:28:33> ntfs = session.GetParameter("ntfs")

# The NTFS object contains a reference to the MFT
[1] Partition2 19:28:38> mft = ntfs.mft[89035]

# Which is just an array of MFT_ENTRY structs
[1] Partition2 19:28:40> print mft
[MFT_ENTRY Array[89035] ] @ 0x056F2C00
0x00 magic [String:magic]: 'FILE'
0x04 fixup_offset [unsigned short:fixup_offset]: 0x00000030
0x06 fixup_count [unsigned short:fixup_count]: 0x00000003
0x08 logfile_sequence_number [unsigned long long:logfile_sequence_number]: 0x2C601977B
0x10 sequence_value [unsigned short:sequence_value]: 0x00000001
0x12 link_count [unsigned short:link_count]: 0x00000001
0x14 attribute_offset [unsigned short:attribute_offset]: 0x00000038
0x16 flags [Flags:flags]: 0x00000001 (ALLOCATED)
0x18 mft_entry_size [unsigned short:mft_entry_size]: 0x00000178
0x1C mft_entry_allocated [unsigned short:mft_entry_allocated]: 0x00000400
0x20 base_record_reference [unsigned long long:base_record_reference]: 0x00000000
0x28 next_attribute_id [unsigned short:next_attribute_id]: 0x00000004
0x30 fixup_magic [String:fixup_magic]: '\x0f\x00'
0x32 fixup_table <Array 2 x String @ 0x056F2C32>
0x38 _attributes <ListArray 0 x NTFS_ATTRIBUTE @ 0x056F2C38>

# We use the convenience method to open the file, returning a suitable address space.
[1] Partition2 19:28:41> fd = mft.open_file()

# We can just read the address space.
[1] Partition2 19:28:45> fd.read(0, 20)
Out > 'Python News\r\n+++++++'
We can also list files in a directory:
[1] Partition2 19:38:00> for record in ntfs.mft[5].list_files():
|..> print record.file.name
$AttrDef
$BadClus
$Bitmap
$Boot
$Extend
$LogFile
$MFT
$MFTMirr
$Recycle.Bin
$Secure
$UpCase
$Volume
.
Config.Msi
cygwin
Documents and Settings
MinGW
pagefile.sys
PerfLogs
Program Files
Program Files (x86)
ProgramData
PROGRA~1
PROGRA~2
PROGRA~3
Python27
Python27.32
Recovery
rekall-profiles
REKALL~1
System Volume Information
SYSTEM~1
Users
websymbols
WEBSYM~1
WinDDK
Windows
[1] Partition2 19:38:16> print record
[INDEX_RECORD_ENTRY ListArray[20] ] @ 0x00001890
0x00 mftReference [BitField(0-48):mftReference]: 0x0000026B
0x06 seq_num [short int:seq_num]: 0x00000001
0x08 sizeOfIndexEntry [unsigned short:sizeOfIndexEntry]: 0x00000060
0x0A filenameOffset [unsigned short:filenameOffset]: 0x00000050
0x0C flags [unsigned int:flags]: 0x00000000
0x10 file [FILE_NAME file] @ 0x000018A0

[1] Partition2 19:38:18> print record.file
[FILE_NAME file] @ 0x000018A0
0x00 mftReference [BitField(0-48):mftReference]: 0x00000005
0x06 seq_num [short int:seq_num]: 0x00000005
0x08 created [WinFileTime:created]: 0x4A5BF968 (2009-07-14 03:20:08+0000)
0x10 file_modified [WinFileTime:file_modified]: 0x5446EF40 (2014-10-21 23:41:52+0000)
0x18 mft_modified [WinFileTime:mft_modified]: 0x5446EF40 (2014-10-21 23:41:52+0000)
0x20 file_accessed [WinFileTime:file_accessed]: 0x5446EF40 (2014-10-21 23:41:52+0000)
0x28 allocated_size [unsigned long long:allocated_size]: 0x00000000
0x30 size [unsigned long long:size]: 0x00000000
0x38 flags [Flags:flags]: 0x10000800 ()
0x3C reparse_value [unsigned int:reparse_value]: 0x00000000
0x40 _length_of_name [byte:_length_of_name]: 0x00000007
0x41 name_type [Enumeration:name_type]: 0x00000000 (POSIX)
0x42 name [UnicodeString:name]: u'Windows' (Windows)
Note that iterating over the index produces a list of INDEX_RECORD_ENTRY structs which also contain FILE_NAME structs within them. The FILE_NAME structs contain the 4 NTFS timestamps quite independently from the timestamps stored in the actual MFT for the file itself (This FILE_NAME struct came from the directory index), this can be forensically significant.
The next example shows how to get the $STANDARD_INFORMATION record for each file:
[1] Partition2 19:56:32> x=ntfs.mft[89035].get_attribute("$STANDARD_INFORMATION")
[1] Partition2 19:57:01> print x.DecodeAttribute()
[STANDARD_INFORMATION STANDARD_INFORMATION] @ 0x00000000
0x00 create_time [WinFileTime:create_time]: 0x4F84B1CC (2012-04-10 22:18:52+0000)
0x08 file_altered_time [WinFileTime:file_altered_time]: 0x4F84B1CC (2012-04-10 22:18:52+0000)
0x10 mft_altered_time [WinFileTime:mft_altered_time]: 0x5123CB64 (2013-02-19 18:58:44+0000)
0x18 file_accessed_time [WinFileTime:file_accessed_time]: 0x5123CB64 (2013-02-19 18:58:44+0000)
0x20 flags [Flags:flags]: 0x00000820 (ARCHIVE, COMPRESSED)
0x24 max_versions [unsigned int:max_versions]: 0x00000000
0x28 version [unsigned int:version]: 0x00000000
0x2C class_id [unsigned int:class_id]: 0x00000000
0x30 owner_id [unsigned int:owner_id]: 0x00000000
0x34 sid [unsigned int:sid]: 0x000002C9
0x38 quota [unsigned long long:quota]: 0x00000000
0x40 usn [unsigned int:usn]: 0xC54A40B8

4. Conclusions

Although the NTFS support in Rekall is still pretty immature we want to make it better and more useful. For a relatively complex filesystem, such as NTFS, the Rekall implementation is pretty small, coming in at around 1000 lines of code (not including the implementation for lznt1 - the NTFS compression algorithm. Additional lines are for plugins etc). It should be possible to support additional filesystems as well. We also want to write more interesting plugins, please let us know any ideas for a good NTFS plugin :-)
Performance is pretty good. One thing you should notice is that Rekall starts up pretty fast since it does not scan the MFT like TSK does. Of course this means that Rekall cant find orphaned files like TSK does! Rekall also does not have a cache of the MFT - making it suitable to operate on a changing live filesystem.
Reading compressed files is currently pretty slow since the lznt1 compression algorithm is implemented in pure python. This could be easily accelerated with a C implementation in future.

Announcing Rekall Release 1.2.1 (Col de la Croix)

$
0
0

Version 1.2.1 Col de la Croix

This release just made it in time for Christmas! Enjoy!

Release Highlights

Filesystems
For the first time Rekall includes experimental support for analysis of traditional Disk images. This release includes a full featured parser for NTFS. Some interesting plugins:
  • fls: List files in the filesystem.
  • istat: Displays information about an MFT entry.
  • idump: hexdump an attribute or stream.
  • iexport: Exports a file from the NTFS.
Windows
This release includes full support for acquisition and analysis of the windows page file. Some interesting plugins include:
  • pagefiles: Lists the currently active page files and their locations.
  • vadmap: Displays each page in the VAD and resolves its location in physical memory (or the page file).
  • vtop: This plugin was expanded to display where virtual pages are actually backed by the page file.
  • dumpfiles: This plugin was finally implemented in Rekall.
  • inspect_heap: Experimental support for heap enumeration on Win7 x64 allows enumeration of userspace heap allocation (e.g. malloc()).
    • dns_cache: This is also used to enumerate the dns cache by inspecting heap allocations.
OSX
This release adds a functional Entity layer. Currently confined to OSX analysis. Entities are a kind of query language for memory artifacts. Some useful plugins:
  • find: Search for entities based on a query.
  • analyze: Analyze the internal query optimizer’s collectors that will be run in response to a query.
  • Most other plugins are rewritten in terms of entities (e.g. lsofnetstat etc.)
Linux
This release brings a dedicated userspace imager to Linux. The lmap tool was expanded to write ELF core dump files and acquire directly from /proc/kcore, if the target system supports it (in this case no kernel module is needed).
  • MIPS address space added for support on Big Endian Machines.
Misc
Rekall can now read and write EWF files natively. There have been many performance and stability improvements too.
  • ewfacquire: Rekall can be used to acquire memory efficiently, writing an EWF compressed file (with an embedded ELF file).
  • The Profile repository is now cached locally to make subsequent runs faster.

Announcing Rekall Release 1.3.1 (Dammastock)

$
0
0

Version 1.3.1 Dammastock.

This release was made at the Rekall Memory Forensic Workshop at DFRWS. For the first time, we ran this workshop completely from the interactive Rekall web console. It was an astounding success, and an impressive medium to deliver an interactive workshop (Check it out here ).

Release Highlights

Memory Acquisition
The major thrust for this release was the updating of the Pmem Acquisition tools to AFF4. In addition to the stable WinPmem 1.6.2, we have made available an experimental pre-release of the WinPmem 2.0 series.
The new imagers feature:
  1. A consistent interface. The same command line arguments used for all operating systems.
  2. The new memory image format we have standardized on is AFF4. This allows us to store multiple streams in the image, such as the page file and additional files.
  3. The pmem imagers are able to embed different files inside the final AFF4 image, such as the kernel image and miscellaneous binaries.
Note that the new imagers are still considered pre-release. Please test but continue using the old imagers for critical work. The best documentation of the new imagers is currently found here under "Memory Acquisition".
GUI Web Console
The GUI was expanded to accommodate multiple sessions. A Rekall session is an object encapsulating all we know about a specific image. With multiple session support in the GUI, we are able to write a single web console document which runs plugins on multiple images simultaneously.
  • The GUI was also adapted to allow for the export of static versions of the document, which can be hosted on a simple web server.
Windows
Rekall will now automatically fetch missing profiles from the Microsoft Symbol Server for critical modules.
  • This was a huge pain point in the past - when MS updated kernels through a patch the kernel was rebuilt resulting in a new profile. By the time the Rekall team pushed the new profile to the profile repository, Rekall was non-functional, requiring users to know how to generate new profiles manually.
  • This new release adds a setting (you can set it in the configuration file permanently or just use the flag --autodetect_build_local). The following values are allowed:
  • none means that Rekall will not fetch profiles from the symbol server (but will still use the profile repositories specified in repository_path).
  • basic is the default setting. Rekall will fetch profiles for selected modules, such as the kernel, win32k.sys, ntdll, tcpip etc. This is usually good enough for most plugins to function correctly.
  • full in this setting Rekall will try the symbol server for all profiles it does not know about. This can be very slow but will produce the best outcome (e.g. disassembly output will be fully annotated).
Linux
Added support for XEN paravirtualized guests.

The Pmem Memory acquisition suite.

$
0
0


The Rekall project has maintained a set of open source memory acquisition tools for a while now. After all, Memory acquisition is the first step in memory analysis. Before any analysis can be done, we need to acquire the memory in the first place. There are a number of commercial solutions to acquire memory, but sadly open source solutions have been abandoned or not maintained (For example win32dd has been a popular solution many years ago but has now been commercialized and is no longer open source).
We believe in open source forensic tools to make testing and transparency easier. We also believe that the availability of open source solutions spurs further development in the field and enables choices.
That is the reason we feel an open source, well tested and capable forensic memory acquisition tool is essential - we call it the Pmem suite of tools. The pmem acquisition tool aims to provide a complete imaging solution for Windows, Linux and OSX (OSXPmem is the only memory acquisition tool we are aware of, which works on the latest version of OSX - 10.10.x - commercial or open source).
As we continue to develop Rekall into the most powerful memory forensic platform, we developed the need to extend the acquisition tool. For example, when Rekall gained the ability to analyze the windows pagefile, it became important that the acquisition tool also collect the page file during acquisition. Similarly we require the tool to collect critical system binaries.
We realized that we were in a unique position - not only are we developing the most cutting edge memory analysis tool, but we are also developing the most advanced memory acquisition tool. By being in control of the development process of both tools, we can leverage the acquisition to assist the analysis, and leverage the analysis to improve the acquisition.
For example, one of the first things that a memory analysis framework requires is to derive the location of the page tables (dtb or CR3), the location of the kernel image in memory (kaslr shift) or the exact version of the kernel. All of these facts are immediately available to the acquisition tool at acquisition time - if only there was a way for the acquisition tool to store this metadata in the image, we would be able to analyze the image faster and more accurately.
Similarly, we often analyze memory images we acquired and discover that we left some evidence behind during acquisition time - for example, if we try to dump executables from memory, we might discover that many file mapped pages are not present in the image. If only we could have acquired these files during the acquisition time…
Our goal is to create a synergy between analysis and acquisition - collect as much information as we can during the acquisition stage, driven by preliminary analysis.
In order to do this preliminary triaging, we need to gain access to the live physical memory of the system. Pmem is the only suite of memory acquisition tools that allow for live forensics of the system they are running on. While other acquisition tools are designed to dump memory image files from kernel space, pmem tools generally pass data into user space and allow user space processes direct access to physical memory.
It turns out that as physical memory sizes increase it takes so long to copy a complete image out to disk, that smear is becoming a significant problem (e.g. on very large servers). In this case live forensic analysis is the only practical solution since the physical memory is examined over a very short period of time (think running a pslist plugin which just follows a linked list).
We actually believe live memory analysis is the way forward.

Image file format

Traditionally acquisition tools (like dd) simply wrote out a RAW format image. This is by far the simplest image file format. In this format, the physical address space is written byte for byte directly into the image file.
The nice thing about a raw image is that you don’t need any special tools to read it - every byte in the file corresponds to the same address in physical memory. Some of the earliest memory analysis tools therefore only worked on RAW images.
However there are a number of problems with RAW images:
  • No ability to store sparse regions - all reserved regions must be padded in the image with zeros giving a larger image size. For example if you have 4GB of RAM, there will be about 1GB PCI hole reserved for DMA (e.g. video cards), so the RAW image is actually 5GB in size.
  • No support for compression, encryption etc. This is a problem because sometimes using a fast compressor can actually produce higher throughput by minimizing IO.
  • No support for additional metadata. This is required for the acquisition tool to tell us these critical constants we need for analysis!
  • No support for embedding additional files, such as the pagefile, kernel image etc.
There are some other image file formats sometimes used but none of them have all the required features:
The Microsoft Crashdump file, for example, is commonly used with windows images - however this is a proprietary, undocumented file format with no support for compression or embedding (although it supports some windows specific metadata) it is also non-extensible. We do not recommend acquiring with this format directly - if you need to analyze the image with the windows debugger we recommend using the Rekall raw2dmp plugin to create a dump file later.
An ELF core file is the standard image format used by GDB and Linux when making a core dump. This format allows the storage of sparse memory regions, but has only limited support for extensible metadata. It is not possible to use this format to collect related files (like the pagefile, kernel image etc). This format is the default produced by versions of Rekall’s pmem acquisition tools prior to version 2.0. Certain virtualization tools like Virtual Box produce memory images in this format so it can still be useful.
EWF is a compression format which is used by Encase. It offers the ability for the image to be compressed but does not support sparse files, nor multiple streams (at least the versions supported by the open source libewf tool).
Various ad-hoc imaging formats that are sometimes used. Rekall can read those if you receive them in this format, but these format are not suitable for our purposes (no compression or multiple files can be collected in the same image file):
  • Limes - an ad-hoc imaging format sometimes used on Linux. Does not really offer any advantages over an ELF core dump.
  • HPAK - A proprietary format used in HBGary’s tools.
  • Mach-O - This is the binary format used on OSX. These kind of images used to be produced by the now defunct “Mac Memory Reader”. Does not really offer any advantages over ELF core dumps.
After version 2.0 Rekall’s pmem suite of acquisition tools have switched to the AFF4 format for the default image format. AFF4 offers all the required features and more:
  • A peer reviewed open standard for storing digital images.
  • Supports compression using the Zlib and Snappy compression formats (Snappy allows imaging at speeds greater than 300mb/s). This is really important to reduce memory smear.
  • Supports storing arbitrary metadata via RDF information triples.
  • Supports collecting multiple files (streams) in the same file. Thus we can collect binaries, pagefile as well as the physical memory the time of acquisition. Rekall can then use all these information sources seamlessly during analysis (i.e. no need to explicitly tell Rekall which is the pagefile).
The image file format is based on the standard Zip file format, with all the advantages that brings, such as readily available tools for recovery of corrupted image files, inspection, verification and manipulation of zip files. Zip files are natively supported in almost every programming language - decompressing an AFF4 stream can be done in 4 lines of python without the use of a special AFF4 library (but the pyaff4 library can also be used).

AFF4 Volume overview.

We said that the AFF4 format is built on top of the standard ZIP format. This means we can actually use the regular zip program to inspect an AFF4 volume.
The following is an image of a Windows Server 2003 system, acquired together with the pagefile. As you can see it is just a zip file:
$ unzip -l images/Windows_Server-2003-R2_SP2-English-32Bit-Base-2015.02.11.aff4

Archive: images/Windows_Server-2003-R2_SP2-English-32Bit-Base-2015.02.11.aff4
aff4://4928ef44-6579-496c-a53e-2ad34d98b7ed
Length Date Time Name
--------- ---------- ----- ----
847 2015-03-10 00:50 information.turtle
56 2015-03-10 00:50 PhysicalMemory/map
64 2015-03-10 00:50 PhysicalMemory/idx
12313883 2015-03-10 00:50 PhysicalMemory/data/00000031
4048 2015-03-10 00:50 PhysicalMemory/data/00000031/index
8 2015-03-10 00:50 c%3a/pagefile.sys/00000016
4096 2015-03-10 00:49 PhysicalMemory/data/00000021/index
4096 2015-03-10 00:49 PhysicalMemory/data/00000024/index
...
166912 2015-03-10 00:50 c%3a/pagefile.sys/00000012
166912 2015-03-10 00:50 c%3a/pagefile.sys/00000013
4096 2015-03-10 00:50 c%3a/pagefile.sys/00000015/index
204 2015-03-10 00:50 PhysicalMemory/information.yaml
4 2015-03-10 00:50 c%3a/pagefile.sys/00000016/index
--------- -------
278598663102 files
We can see that the AFF4 volume is denoted by a globally unique name aff4://4928ef44-6579-496c-a53e-2ad34d98b7ed. This is called the AFF4 URN and uniquely identifies this volume. The metadata is stored in this volume’s archive member called “information.turtle”. We also see a number of streams - ThePhysicalMemory is the memory stream of the machine’s physical memory, “c%3a/pagefile.sys” is the stream corresponding with the machine’s pagefile.
Lets examine the metadata stored in the information.turtle archive member:
$ unzip -p images/Windows_Server-2003-R2_SP2-English-32Bit-Base-2015.02.11.aff4 information.turtle
@base <aff4://4928ef44-6579-496c-a53e-2ad34d98b7ed> .
@prefix rdf: <http://www.w3.org/1999/02/22-rdf-syntax-ns#> .
@prefix aff4: <http://aff4.org/Schema#> .
@prefix xsd: <http://www.w3.org/2001/XMLSchema#> .
@prefix memory: <http://aff4.org/Schema#memory/> .

</PhysicalMemory>
aff4:category memory:physical ;
aff4:stored <> ;
a aff4:map .

</PhysicalMemory/data>
aff4:chunk_size 32768 ;
aff4:chunks_per_segment 1024 ;
aff4:compression <https://www.ietf.org/rfc/rfc1950.txt> ;
aff4:size 1073336320 ;
aff4:stored <> ;
a aff4:image .

</c:/pagefile.sys>
aff4:category memory:pagefile ;
aff4:chunk_size 32768 ;
aff4:chunks_per_segment 1024 ;
aff4:compression <https://www.ietf.org/rfc/rfc1950.txt> ;
memory:pagefile_number 0 ;
aff4:size 536870912 ;
aff4:stored <> ;
a aff4:image .
This shows us all the streams that exist in this volume encoded using the Turtle RDF serialization. Each stream has a number of attributes (key value pairs). The stream aff4://4928ef44-6579-496c-a53e-2ad34d98b7ed/PhysicalMemory has a category of memory:physical (i.e. it is a physical memory image). It is implemented as an aff4:map stream - i.e. this is a sparse stream which uses aff4://4928ef44-6579-496c-a53e-2ad34d98b7ed/PhysicalMemory/data as backing storage.
We can see the backing stream is an aff4:image typed stream with 32kb chunks, 1024 chunks per segment, using zlib compression.
Additionally we can see the pagefile is stored in a separate stream with a category memory:pagefile (Rekall can then use the category to automatically know how to use each stream).

The PMEM suite of acquisition tools.

The Rekall project maintains a set of acquisition tools for the three supported operating systems: Windows, Linux and OSX. Since version 2.0, the three imagers have been merged into a single common framework. This means that you use them in the same way, and they all produce the same type of AFF4 images.
All imagers share the common AFF4 imager architecture. This means you can use all imagers for basic manipulation of all AFF4 volumes. Hence we will discuss these common features here. Below we discuss some of the differences in the implementations between the operating systems.
Lets consider the output from the –help command:
$ linpmem --help
USAGE:

linpmem [--elf] [-m] [-p </path/to/pagefile>] ... [-V] [-d] [-v] [-t]
[-i </path/to/file/or/device>] ... [-e <string>] [-o
</path/to/file>] [-c <zlib,snappy,none>] [--] [--version]
[-h] </path/to/aff4/volume> ...


Where:

--elf
Normally pmem will produce an AFF4 volume but this option will force
an ELF Core image file to be produced during acquisition. Note that
this option is not compatible with the --input or --pagefile options
because we can not write multiple streams into an ELF file.

This option is mostly useful for compatibility with legacy memory
analysis tools which do not understand AFF4 images.

If this option is used together with the --export option we will
export an ELF file from a stream within the AFF4 image.

-m, --acquire-memory
Normally pmem will only acquire memory if the user has not asked for
something else (like acquiring files, exporting etc). This option
forces memory to be acquired. It is only required when the program is
invoked with the --input, --export or other actionable flags.


-p </path/to/pagefile>, --pagefile </path/to/pagefile> (accepted
multiple times)
Also capture the pagefile. Note that you must provide this option
rather than e.g. '--input c:\pagefile.sys' because we can not normally
read the pagefile directly. This option will use the sleuthkit to read
the pagefile.

-V, --view
View AFF4 metadata

-d, --debug
Display debugging logging

-v, --verbose
Display more verbose information

-t, --truncate
Truncate the output file. Normally volumes and images are appended to
existing files, but this flag forces the output file to be truncated
first.

-i </path/to/file/or/device>, --input </path/to/file/or/device>
(accepted multiple times)
File to image. If specified we copy this file to the output volume
located at --output. If there is no AFF4 volume on --output yet, we
create a new volume on it.

This can be specified multiple times with shell expansion. e.g.:

-i /bin/*

-e <string>, --export <string>
Name of the stream to export. If specified we try to open this stream
and write it to the --output file. Note that you will also need to
specify an AFF4 volume path to load so we know where to find the
stream. Specifying a relative URN implies a stream residing in a
loaded volume. E.g.

-e /dev/sda -o /tmp/myfile my_volume.aff4

-o </path/to/file>, --output </path/to/file>
Output file to write to. If the file does not exist we create it.

-c <zlib,snappy,none>, --compression <zlib,snappy,none>
Type of compression to use (default zlib).

--, --ignore_rest
Ignores the rest of the labeled arguments following this flag.

--version
Displays version information and exits.

-h, --help
Displays usage information and exits.

</path/to/aff4/volume> (accepted multiple times)
These AFF4 Volumes will be loaded and their metadata will be parsed
before the program runs.

Note that this is necessary before you can extract streams with the
--export flag.


The LinuxPmem memory imager. Copyright 2014 Google Inc.

Inspecting an AFF4 Volume.

The tool can examine an AFF4 volume as we have seen previously. It actually loads the provided AFF4 volume and outputs a common view of all known objects.
$ linpmem -V images/Windows_Server-2003-R2_SP2-English-32Bit-Base-2015.02.11.aff4
@prefix rdf: <http://www.w3.org/1999/02/22-rdf-syntax-ns#> .
@prefix aff4: <http://aff4.org/Schema#> .
@prefix xsd: <http://www.w3.org/2001/XMLSchema#> .
@prefix memory: <http://aff4.org/Schema#memory/> .

<aff4://4928ef44-6579-496c-a53e-2ad34d98b7ed/PhysicalMemory>
aff4:category memory:physical ;
aff4:stored <aff4://4928ef44-6579-496c-a53e-2ad34d98b7ed> ;
a aff4:map .

<aff4://4928ef44-6579-496c-a53e-2ad34d98b7ed/PhysicalMemory/data>
aff4:chunk_size 32768;
aff4:chunks_per_segment 1024;
aff4:compression <https://www.ietf.org/rfc/rfc1950.txt> ;
aff4:size 1073336320;
aff4:stored <aff4://4928ef44-6579-496c-a53e-2ad34d98b7ed> ;
a aff4:image .

<aff4://4928ef44-6579-496c-a53e-2ad34d98b7ed/c:/pagefile.sys>
aff4:category memory:pagefile ;
aff4:chunk_size 32768;
aff4:chunks_per_segment 1024;
aff4:compression <https://www.ietf.org/rfc/rfc1950.txt> ;
memory:pagefile_number 0;
aff4:size 536870912;
aff4:stored <aff4://4928ef44-6579-496c-a53e-2ad34d98b7ed> ;
a aff4:image .

<file:///home/scudette/images/Windows_Server-2003-R2_SP2-English-32Bit-Base-2015.02.11.aff4>
aff4:contains <aff4://4928ef44-6579-496c-a53e-2ad34d98b7ed> .

Extracting a stream from an AFF4 volume.

We can extract one of the streams to a file. This is sometimes useful for using tools which do not support AFF4 natively. For example, we can extract the pagefile into the /tmp/ directory:
$ linpmem --export /c:/pagefile.sys --output /tmp/pagefile.sys images/Windows_Server-2003-R2_SP2-English-32Bit-Base-2015.02.11.aff4

Extracting aff4://4928ef44-6579-496c-a53e-2ad34d98b7ed/c:/pagefile.sys into file:///tmp/pagefile.sys
Reading 0xa00000 10MiB / 512MiB 0MiB/s
Reading 0x5000000 80MiB / 512MiB 266MiB/s
Reading 0xc800000 200MiB / 512MiB 474MiB/s
Reading 0x15e00000 350MiB / 512MiB 586MiB/s
Reading 0x19a00000 410MiB / 512MiB 236MiB/s
Reading 0x1d600000 470MiB / 512MiB 216MiB/s

Adding a new stream to an AFF4 volume.

By default the AFF4 imager tools append streams to existing volumes, rather than overwrite the volume. Therefore it is easy to add additional files after the acquisition is complete to the acquired volume. It is also possible to specify shell globs to add multiple files to the volume. In this sense, the AFF4 volume acts more like a zip container - you can just keep on adding new files.
This is handy if initial analysis reveals some suspected files which we can acquire immediately into the AFF4 volume after the memory is captured. The -t flag explicitly allows pmem to truncate the output file (this will delete all current content of the volume).
For example, the following will add files in /bin/* to the AFF4 volume (without overwriting it).
$ linpmem -i /bin/* -o /tmp/test.aff4

Adding /bin/bash as file:///bin/bash
Adding /bin/bsd-csh as file:///bin/bsd-csh
Adding /bin/bunzip2 as file:///bin/bunzip2
Adding /bin/busybox as file:///bin/busybox
Adding /bin/bzcat as file:///bin/bzcat
Adding /bin/bzcmp as file:///bin/bzcmp
Adding /bin/bzdiff as file:///bin/bzdiff

The WinPmem acquisition tool.

On Windows, one must insert a signed driver in order to gain access to physical memory. WinPmem from version 2.0 is built on top of the AFF4 imager technology, and is packaged bundled with the appropriate memory drivers. Since AFF4 volumes utilize zip file, as their underlying storage format, it is possible to append an AFF4 volume to the end of any other file type. The WinPmem acquisition tool utilizes this property to simply package all needed drivers and tools together with the executable itself - using the AFF4 format.
We typically package with winpmem the 64 bit and 32 bit windows kernel drivers, as well as a copy of fcat.exe from the sleuthkit . This tool is used to provide access to the locked pagefiles. (Note that if you just want to extract the drivers - e.g. to use in another project you can just unzip the winpmem executable).
If no other operation was specified, WinPmem will immediately image memory and also acquire certain files, such as drivers and the kernel image. These are useful to preserve the exact versions of binaries running on the system at the time of the acquisition.
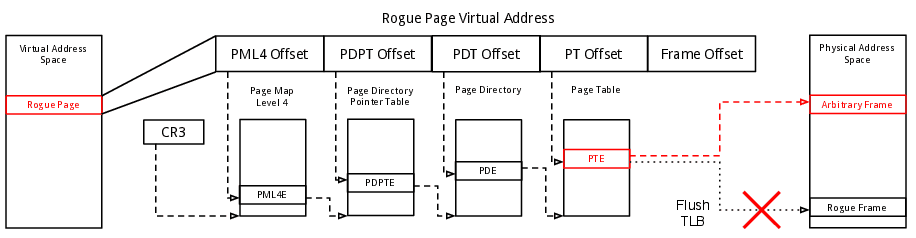
By default WinPmem uses a technique called PTE Remapping to acquire memory. This technique was originally developed in order to bypass potential malware hooking the APIs normally used for acquisition. After much use we found that the technique is in fact more stable than using the APIs and it is actually the only reliable way that access to physical memory is achievable on OSX. We therefore decided to make this the default acquisition mode on both Windows and OSX.
To acquire memory all one needs to do is to specify the output volume:
C:\Users\mic>winpmem_2.0.1.exe -o test.aff4
Driver Unloaded.
CR3: 0x0000187000
2 memory ranges:
Start 0x00001000 - Length 0x0009E000
Start 0x00100000 - Length 0x3FEF0000
Dumping Range 0 (Starts at 1000)
Dumping Range 1 (Starts at 100000)
Adding C:\Windows\SysNative\drivers/1394bus.sys as file:///C:/Windows/SysNative/drivers/1394bus.sys
Adding C:\Windows\SysNative\drivers/1394ohci.sys as file:///C:/Windows/SysNative/drivers/1394ohci.sys
Adding C:\Windows\SysNative\drivers/acpi.sys as file:///C:/Windows/SysNative/drivers/acpi.sys
Adding C:\Windows\SysNative\drivers/acpipmi.sys as file:///C:/Windows/SysNative/drivers/acpipmi.sys
Adding C:\Windows\SysNative\drivers/adp94xx.sys as file:///C:/Windows/SysNative/drivers/adp94xx.sys
Adding C:\Windows\SysNative\drivers/adpahci.sys as file:///C:/Windows/SysNative/drivers/adpahci.sys
....
Adding C:\Windows\SysNative\drivers/WUDFPf.sys as file:///C:/Windows/SysNative/drivers/WUDFPf.sys
Adding C:\Windows\SysNative\drivers/WUDFRd.sys as file:///C:/Windows/SysNative/drivers/WUDFRd.sys
Driver Unloaded.
Note that by default the imager also captures the kernel and driver binaries. You can also choose the snappy compression (--compression snappy) for a faster compression algorithm.
Now we can use rekall to analyze this image:
C:\Users\mic>"c:\Program Files\Rekall\rekal.exe" -f test.aff4

----------------------------------------------------------------------------
The Rekall Memory Forensic framework 1.3.2 (Dammastock).

"We can remember it for you wholesale!"

This program is free software; you can redistribute it and/or modify it under
the terms of the GNU General Public License.

See http://www.rekall-forensic.com/docs/Manual/tutorial.html to get started.
----------------------------------------------------------------------------
[1] test.aff4 15:56:05> pslist
_EPROCESS Name PID PPID Thds Hnds Sess Wow64 Start
-------------- -------------------- ----- ------ ------ -------- ------ ------ ------------------------
0xfa8000c9f040 System 4 0 79 528 - False 2015-04-24 12:12:36+0000
0xfa8000ea3340 SearchProtocol 208 2336 7 284 0 False 2015-04-24 13:37:11+0000
0xfa8001d229f0 smss.exe 228 4 2 29 - False 2015-04-24 12:12:36+0000

The LinPmem acquisition tool.

By default, the linpmem acquisition tool uses the /proc/kcore device to acquire physical memory. This device must be enabled during kernel configuration but we found that in most distributions the device is already enabled.

The OSXPmem acquisition tool

OSXPmem has recently been updated with a new driver written by Adam Sindelar called MacPmem.kext. The new driver is more stable and works on all versions of OSX including the most recent 10.10 series. The new driver presents two devices:
  1. The /dev/pmem device is the raw physical memory device - reading from this device allows userspace applications (running as root) to read physical memory - e.g. Rekall itself can be used for live analysis.
  2. The /dev/pmem_info device presents information collected by the driver about the system - such as the EFI ranges, kernel slide and other critical parameters.
The following example illustrates how we can image memory on OSX. First we must elevate to the root user, then unzip the contents of theosxpmem.zip distribution. Note that the MacPmem.kext directory and its content must be owned by root with group wheel, otherwise kextloadwill refuse to insert the kernel module.
Next we simply load the driver using kextload and run the acquisition tool to create the AFF4 volume.
$ sudo bash
Password:
# unzip osxpmem_2.0.1.zip
Archive: osxpmem_2.0.1.zip
creating: osxpmem.app/
creating: osxpmem.app/libs/
inflating: osxpmem.app/libs/libaff4.0.dylib
inflating: osxpmem.app/libs/libcrypto.1.0.0.dylib
inflating: osxpmem.app/libs/libcurl.4.dylib
inflating: osxpmem.app/libs/libgflags.2.dylib
inflating: osxpmem.app/libs/libglog.0.dylib
inflating: osxpmem.app/libs/libiconv.2.dylib
inflating: osxpmem.app/libs/libidn.11.dylib
inflating: osxpmem.app/libs/libintl.8.dylib
inflating: osxpmem.app/libs/liblzma.5.dylib
inflating: osxpmem.app/libs/libpcre++.0.dylib
inflating: osxpmem.app/libs/libpcre.1.dylib
inflating: osxpmem.app/libs/libraptor2.0.dylib
inflating: osxpmem.app/libs/libsnappy.1.dylib
inflating: osxpmem.app/libs/libssl.1.0.0.dylib
inflating: osxpmem.app/libs/liburiparser.1.dylib
inflating: osxpmem.app/libs/libuuid.16.dylib
inflating: osxpmem.app/libs/libxml2.2.dylib
inflating: osxpmem.app/libs/libxslt.1.dylib
inflating: osxpmem.app/libs/libz.1.dylib
creating: osxpmem.app/MacPmem.kext/
creating: osxpmem.app/MacPmem.kext/Contents/
creating: osxpmem.app/MacPmem.kext/Contents/_CodeSignature/
inflating: osxpmem.app/MacPmem.kext/Contents/_CodeSignature/CodeResources
inflating: osxpmem.app/MacPmem.kext/Contents/Info.plist
creating: osxpmem.app/MacPmem.kext/Contents/MacOS/
inflating: osxpmem.app/MacPmem.kext/Contents/MacOS/MacPmem
inflating: osxpmem.app/osxpmem
inflating: osxpmem.app/README.md
# kextload osxpmem.app/MacPmem.kext/
# ./osxpmem.app/osxpmem -o /tmp/test.aff4

Imaging memory
E0424 16:26:04.297508
2091074320 osxpmem.cc:138] Range 0 581632
E0424 16:26:04.297526
2091074320 osxpmem.cc:138] Range 589824 65536
E0424 16:26:04.297534
2091074320 osxpmem.cc:138] Range 1048576 535822336
E0424 16:26:04.297541
2091074320 osxpmem.cc:138] Range 538968064 534790144
E0424 16:26:04.297549
2091074320 osxpmem.cc:138] Range 1073762304 1257820160
E0424 16:26:04.297555
2091074320 osxpmem.cc:138] Range 2332028928 4096
E0424 16:26:04.297562
2091074320 osxpmem.cc:138] Range 4294967296 14753464320
Reading 0x19100000 400MiB / 511MiB 55MiB/s
Adding /mach_kernel as file:///mach_kernel77MiB/s
Adding /dev/pmem_info as file:///dev/pmem_info
Adding /System/Library/Extensions/ALF.kext/Contents/MacOS/ALF as file:///System/Library/Extensions/ALF.kext/Contents/MacOS/ALF
Adding /System/Library/Extensions/ALF.kext/Contents/Resources/Dutch.lproj/ as file:///System/Library/Extensions/ALF.kext/Contents/
Resources/Dutch.lproj/
Adding /System/Library/Extensions/ALF.kext/Contents/Resources/English.lproj/ as file:///System/Library/Extensions/ALF.kext/Content
s/Resources/English.lproj/
...
# cat /dev/pmem_info | head
%YAML 1.2
---
meta:
pmem_api_version: 1
cr3: 14860288073
dtb_off: 14860288000
phys_mem_size: 17179869184
pci_config_space_base: 3758096384
mmap_poffset: 107778048
mmap_desc_version: 1
mmap_size: 13776
mmap_desc_size: 48
kaslr_slide: 62914560
kernel_poffset: 63963136
kernel_version:
"Darwin Kernel Version 13.4.0: Wed Mar 18 16:20:14 PDT 2015; root:xnu-2422.115.14~1/RELEASE_X86_64"
records:
- purpose:
"(PCI) IGPU/0"
type: "pci_range"
pci_type:
"PCIUnknownMemory"
start: 4768923648
length: 4194304
hw_informant:
false
As usual live analysis can be performed by simply specifying the /dev/pmem device for Rekall.

Adding Rekall's Windows 10 Support.

$
0
0

Rekall 1.4.0 (Etzel) is released

$
0
0
This is the next release of the Rekall Memory Forensic framework, code named after the Etzel pass, not far from Zurich.
I am excited to announce the new Rekall release is out. This release introduces a lot of revolutionary features. Some of the more exciting new features include:
  • Windows support:
    • Windows 10 - This release supports WIndows 10 in most plugins. Although support is not complete yet, we will be working hard to make all plugins work in subsequent releases.
    • Better support of pagefiles. The address translation algorithm in Rekall has been overhauled and re-written. The new code supports describing the address translation process for increased provenance (using the vtop plugin). On Windows, Rekall now supports mapping files into the physical address space. This allows plugins to read memory mapped files transparently (if the file data is available).
    • Better heap enumeration algorithms. Rekall supports enumerating more of the Low Fragmentation Heap (LFH). Currently heap enumeration is only supported on 64 bit Windows processes compiled with MSVC.
    • All references to file names are now written with the full drive letter and path. Drive letters and path normalization is done by following the symlinks in the object tree. 
    • The new mimikatz plugin contributed by Francesco Picasso has been completely overhauled - it now also provides master keys from lsasrv as well as livessp analysis.
  • OSX and Linux support:
    • Common interactive plugins were added like address resolver/dump/cc/pas2vas etc. This improves the workflow with these OSs.
    • Sigscan is now available for all OSs: Quickly determine if a machine matches a hex signature that supports wildcards.
  • Framework
    • Rekall now has persistent stable cache. This means that re-launching Rekall on an image we analyzed in the past will suddenly be very fast. This is especially useful for plugins like pas2vas which take some time to run initially but when run subsequently this will be very fast.
    • Logging API changes. Logging is now done via the session object allowing external users of Rekall as a library to access log messages.
    • Efilter querying framework was externalized into its own project and expanded.
  • Packaging
    • Rekall is now separated into three packages:
    • Rekall core contains all you need to use Rekall as a library. It does not have ipython as a dependency but if you also install ipython, the core can use it.
    • Rekall GUI is the Rekall web console GUI.
    • Rekall is now a metapackage which depends on both other packages.
  • Imaging
    • Rekall gained the aff4acquire plugin in the last release but now:
    • The plugin can acquire pagefiles by itself using the Rekall NTFS parser.
    • Also acquire all the mapped files. This resolves all address translation requirements during the analysis stage as Rekall can later map all section objects to read memory mapped files.
As usual you can download the latest release from our download page

Windows Virtual Address Translation - Part 2.

$
0
0
We have previously discussed the Windows address translation mechanism back in 2014. As far as we know, Rekall is still the only memory forensic tool that actually performs accurate address translation. In this post we examine some of the new features in the latest Rekall release supporting advanced address translation, and how this is used in practice.
I recently attended The Twentieth IEEE Symposium on Computers and Communications conference where we presented our paper titled Forensic Analysis of Windows User space Applications through Heap allocations. The paper covers the work we did in Rekall in researching the Windows address translation algorithm, and the Microsoft heap implementation. (Both these topics were previously also discussed on this blog).
The paper is quite large and covers a lot of ground. In this blog post we will focus on the first part, namely the address translation process. In a future blog post we will discuss the second part of the paper, namely using heap allocations for reverse engineering.
Since our original blog posts, we have discovered several cases which were not covered by the original research. It seems that the Windows address translation process is quite complex and subtle. In order to properly support the full algorithm we have rewritten the address translation code in Rekall from scratch. The new implementation has some interesting features:
  1. The implementation balances provenance with efficiency - It is always possible to query Rekall about how it arrived at a particular result. This is important when implementing complex address translation algorithms. You can inspect the address translation process, step by step, using the vtop() plugin.
  2. The new implementation is able to map files into the physical address space. This makes them available to the rest of Rekall transparently. For example, the pagefile may be mapped into the physical address space at a particular offset, then a read() operation on the physical address space will actually end up reading from the pagefile. Rekall’s address translation process therefore only need return an offset into the physical address space at the file’s mapping.
This second point is actually very cool as it can be used to map memory mapped files into the physical address space too. When a file is mapped into memory, the PTE corresponding to the virtual page may be pointing to a _SUBSECTION struct. In practice on a running system, if an application tries to access this virtual address, a page fault will occur and Windows will read the file into a physical page, on demand. Unfortunately, for memory forensics analysts it is impossible to recover this data from an image of physical memory - since the data is not actually in physical memory. So previously the best we could do, was to show that this virtual address is a subsection PTE and where the data would be coming from (e.g. filename and offset inside the file).
With the new address translation code, it is possible for Rekall to resolve this if it can find the file itself. This requires that the mapped file be acquired together with the physical memory, but once this is done, Rekall will transparently map the file into the physical address space and serve read() requests from it. Here is an example:
[1] test.aff4 09:15:28> vtop 0x00013fb91000

****************** 0x13fb91000 ******************
Virtual 0x00013fb91000 Page Directory 0x2e142000
pml4e@ 0x2e142000 = 0x10f000002e85f867
pdpte@ 0x2e85f020 = 0x3b000002ebe0867
pde@ 0x2ebe0fe8 = 0x2d0000013821867
pte@ 0x13821c88 = 0xf8a001ca40600400
[_MMPTE_PROTOTYPE Proto] @ 0x000013821c88
Offset Field Content
------ ------------------------------ -------
0x-1 Proto <_MMPTE Pointer to [0xF8A001CA4060] (Pointer)>
0x0 Protection [Enumeration:Enumeration]: 0x00000000 (MM_ZERO_ACCESS)
0x0 ProtoAddress [BitField(16-64):ProtoAddress]: 0xF8A001CA4060
0x0 Prototype [BitField(10-11):Prototype]: 0x00000001
0x0 ReadOnly [BitField(8-9):ReadOnly]: 0x00000000
0x0 Unused0 [BitField(1-8):Unused0]: 0x00000000
0x0 Unused1 [BitField(9-10):Unused1]: 0x00000000
0x0 Valid [BitField(0-1):Valid]: 0x00000000
[_MMPTE_SUBSECTION Subsect] @ 0xf8a001ca4060
Offset Field Content
------ ------------------------------ -------
0x-1 Subsection <_SUBSECTION Pointer to [0xFA8002A52EA8] (Pointer)>
0x0 Protection [Enumeration:Enumeration]: 0x00000003 (MM_EXECUTE_READ)
0x0 Prototype [BitField(10-11):Prototype]: 0x00000001
0x0 SubsectionAddress [BitField(16-64):SubsectionAddress]: 0xFA8002A52EA8
0x0 Unused0 [BitField(1-5):Unused0]: 0x00000000
0x0 Unused1 [BitField(11-16):Unused1]: 0x00000000
0x0 Valid [BitField(0-1):Valid]: 0x00000000
Subsection PTE to file C:\Windows\System32\VBoxTray.exe @ 0x400
Physical Address 0x400 @ aff4://dea18f67-b60c-495f-9f23-ff3f2eeaf30b/C%3A%5CWindows%5CSystem32%5CVBoxTray.exe (Mapped 0x406eb5a4)

Deriving physical address from runtime physical address space:
Physical Address 0x400 @ aff4://dea18f67-b60c-495f-9f23-ff3f2eeaf30b/C%3A%5CWindows%5CSystem32%5CVBoxTray.exe (Mapped 0x406eb5a4)
In this example, the hardware PTE is recognized as a Prototype PTE (i.e. it is a symlink to the real PTE). The real PTE is, however, a _MMPT_SUBSECTION PTE which means it is simply a placeholder pointing at a _SUBSECTION structure which manages a mapping to the fileC:\Windows\System32\VBoxTray.exe.
In this case, however, Rekall has the actual file in the AFF4 volume. It therefore can map it into the physical address space. A read() request will recover the relevant data directly from the mapped file!
The vadmap plugin enumerates the state of each page in a process’s address space. This is very useful to see an overview of how pages are arranged in the process virtual address space. For example, examining the VBoxTray.exe process:
[1] test.aff4 09:28:56> vadmap 2084, start=0x00013fb90000
**************************************************
Pid: 2084 VBoxTray.exe
Virt Addr Length Type Comments
-------------- -------------- -------------------- --------
0x00013fb90000 0x1000 Valid PhysAS @ 0x18f2e000
0x00013fb91000 0x1000 File Mapping C:\Windows\System32\VBoxTray.exe @ 0x400 (P)
0x00013fb92000 0x1000 Valid PhysAS @ 0x2ea47000
0x00013fb93000 0x1000 File Mapping C:\Windows\System32\VBoxTray.exe @ 0x2400 (P)
0x00013fb94000 0x1000 Transition PhysAS @ 0x31086000 (P)
0x00013fb95000 0x1000 File Mapping C:\Windows\System32\VBoxTray.exe @ 0x4400 (P)
0x00013fb96000 0x8000 Valid PhysAS @ 0x543b000
0x00013fb9e000 0x1000 File Mapping C:\Windows\System32\VBoxTray.exe @ 0xd400 (P)
0x00013fb9f000 0x2000 Valid PhysAS @ 0x2e65d000
0x00013fba1000 0x1000 File Mapping C:\Windows\System32\VBoxTray.exe @ 0x10400 (P)
0x00013fba2000 0x1000 Valid PhysAS @ 0x2e820000
If we wanted to dump the executable from memory, previously, the dumpfiles plugin would dump the pages in the "Valid" or "Transition" state, but would have to zero pad the pages in "File Mapping" state (since the data was not available). However, now that Rekall can map the acquired executable from disk into the gaps, the dumped executable is kind of a combination of some pages from disk, and some pages from memory. This is especially important if malware manipulates the code in memory (e.g. installing detour hooks or other code modification) which are not present on disk. What we get now is the overlay of memory with the disk as it is visible to the running system.

Live Analysis

The example above demonstrates how this works with an AFF4 image (once all mapped files have been captured). But the new address transition mechanism works just as well with live analysis using the WinPmem memory acquisition driver. In this case, Rekall is able to directly open any mapped files on demand - and even parse the NTFS on the live system in order to recover locked files.
For example, consider the following (swapper.exe) program which maps "notepad.exe" for reading (it is not actually running notepad, it is only mapped into the address space) and then read some bytes from the third page. This causes some of the pages to be faulted in but many of the mapped pages remain as Subsection PTEs.
char*create_file_mapping(){
TCHAR*filename = L"c:\\windows\\notepad.exe";
HANDLE h =CreateFile(filename, GENERIC_READ,FILE_SHARE_READ,NULL,OPEN_EXISTING,
FILE_FLAG_SEQUENTIAL_SCAN,NULL);

DWORD size =GetFileSize(h, NULL);
HANDLE hFileMapping =CreateFileMapping(h, NULL,PAGE_READONLY,0,0, NULL);
if(h=INVALID_HANDLE_VALUE){
LogLastError();
};

char*view =(char*)MapViewOfFileEx(hFileMapping, FILE_MAP_READ,0,0,0,NULL);
if(!view){
LogLastError();
};

// Read the third page of the file mapping.
view +=0x1000*3;
printf("Contents of %p %s\n", view, view);

return view;
}
Lets examine what it looks like in the vad output (a little truncated for briefness):
[1] pmem 21:08:05> vad 2668
Pid: 2668 swapper.exe
VAD lev Start Addr End Addr com ------- ------ Protect Filename
-------------- --- -------------- -------------- ------ -------------------- --------
......
0xfa80027775c0 5 0x000000300000 0x00000030ffff 8 Private READWRITE
0xfa800262b2e0 6 0x000000310000 0x00000033ffff 0 Mapped READONLY \Windows\notepad.exe
0xfa8002d42170 4 0x000000370000 0x0000003effff 6 Private READWRITE
.....

[1] pmem 21:08:08>
vadmap 2668, start=0x000000310000
**************************************************
Pid: 2668 swapper.exe
Virt Addr Length Type Comments
-------------- -------------- -------------------- --------
0x000000310000 0x3000 File Mapping C:\Windows\notepad.exe (P)
0x000000313000 0x1000 Valid PhysAS @ 0x20b89000
0x000000314000 0x7000 Transition PhysAS @ 0x3218a000 (P)
0x00000031b000 0x25000 File Mapping C:\Windows\notepad.exe @ 0xb000 (P)
0x000000370000 0x6000 Valid PhysAS @ 0x1e8bc000
0x000000376000 0x7a000 Demand Zero
0x0000005a0000 0x6000 Valid PhysAS @ 0x2d057000
As we can see the first 3 pages are merely mapped (i.e. not read), the next 8 pages are read into memory and the rest of the file is also not read but mapped in. Let us examine the first page of the mapped file in details:
[1] pmem 21:11:33> vtop 0x000000310000

******************** 0x310000 ********************
Virtual 0x000000310000 Page Directory 0x1b1da000
pml4e@ 0x1b1da000 = 0x700000297bd867668)
pdpte@ 0x297bd000 = 0xb00000054c1867
pde@ 0x54c1008 = 0x8c00000229bb867
pte@ 0x229bb880 = 0x0
[_MMPTE_SOFTWARE Soft] @ 0x0000229bb880
Offset Field Content
------ ------------------------------ -------
0x0 InStore [BitField(22-23):InStore]: 0x00000000
0x0 PageFileHigh [BitField(32-64):PageFileHigh]: 0x00000000
0x0 PageFileLow [BitField(1-5):PageFileLow]: 0x00000000
0x0 Protection [Enumeration:Enumeration]: 0x00000000 (MM_ZERO_ACCESS)
0x0 Prototype [BitField(10-11):Prototype]: 0x00000000
0x0 Reserved [BitField(23-32):Reserved]: 0x00000000
0x0 Transition [BitField(11-12):Transition]: 0x00000000
0x0 UsedPageTableEntries [BitField(12-22):UsedPageTableEntries]: 0x00000000
0x0 Valid [BitField(0-1):Valid]: 0x00000000
Consulting Vad: Prototype PTE is found in VAD
**************************************************
Pid: 2668 swapper.exe
VAD lev Start Addr End Addr com ------- ------ Protect Filename
-------------- --- -------------- -------------- ------ -------------------- --------
0xfa800262b2e0 6 0x000000310000 0x00000033ffff 0 Mapped READONLY \Windows\notepad.exe

_MMVAD.FirstPrototypePte: 0xf8a000ce6820
Prototype PTE is at virtual address 0xf8a000ce6820 (Physical Address 0x18540820)
[_MMPTE_SUBSECTION Subsect] @ 0xf8a000ce6820
Offset Field Content
------ ------------------------------ -------
0x-1 Subsection <_SUBSECTION Pointer to [0xFA8000E032E0] (Pointer)>
0x0 Protection [Enumeration:Enumeration]: 0x00000006 (MM_EXECUTE_READWRITE)
0x0 Prototype [BitField(10-11):Prototype]: 0x00000001
0x0 SubsectionAddress [BitField(16-64):SubsectionAddress]: 0xFA8000E032E0
0x0 Unused0 [BitField(1-5):Unused0]: 0x00000000
0x0 Unused1 [BitField(11-16):Unused1]: 0x00000000
0x0 Valid [BitField(0-1):Valid]: 0x00000000
Subsection PTE to file C:\Windows\notepad.exe @ 0x0
Physical Address 0x547f4000


Deriving physical address from runtime physical address space:
Physical Address 0x547f4000
Despite the PTE only referring to the mapped page, Rekall can find the file on disk (Rekall maps a view of the file into the physical address space), and so now if we use the dump plugin to view a hexdump of that first page we can see the familiar MZ PE file header. It must be stressed that this data is not in memory at all: Rekall has recovered it from the disk itself - on demand, using live analysis.
[1] pmem 21:11:46> dump 0x000000310000
DEBUG:rekall.1:Running plugin (dump) with args ((3211264,)) kwargs ({})
Offset Data
-------------- ----------------------------------------------------------------- ---------------
0x310000 4d 5a 90 00 03 00 00 00 04 00 00 00 ff ff 00 00 MZ.............. \Windows\notepad.exe
0x310010 b8 00 00 00 00 00 00 00 40 00 00 00 00 00 00 00 ........@.......
0x310020 00 00 00 00 00 00 00 00 00 00 00 00 00 00 00 00 ................
0x310030 00 00 00 00 00 00 00 00 00 00 00 00 e8 00 00 00 ................
0x310040 0e 1f ba 0e 00 b4 09 cd 21 b8 01 4c cd 21 54 68 ........!..L.!Th
0x310050 69 73 20 70 72 6f 67 72 61 6d 20 63 61 6e 6e 6f is.program.canno
Rekall can similarly use the pagefile on a live system too. In that case Rekall reads the page file using the raw NTFS support - bypassing the OS APIs (which normally lock the pagefile while the system is running).

Test images

We did not reverse engineer any code in order to research the Windows address translation process. Instead we created a test program that generated known patterns of user space memory. We then ran the program and acquired the image. Our goal was to have Rekall reconstruct the known memory pattern, as a test of Rekall’s efficacy. The program was previously already published here, so readers can repeat this test on their own.
To make it even easier to independently verify and discuss the Windows address translation process, we are now making a reference image available here. In this blog post we will examine theswapper_test_paged_pde.aff4 image in details. Readers can replicate the analysis using at least Rekall 1.4 (Etzel). We also hope that readers can use these images to test and evaluate other memory analysis tools. Tool testing and verification can only improve the general state of memory analysis tools.

Forensic provenance

Since we introduced complex, OS specific address translation to Rekall, there was a need to explain the address translation process in detail. This improved forensic provenance and assists users in really understanding what Rekall is doing under the covers. We added the vtop plugin to Rekall for this purpose. To use this plugin, the users can switch first into the desired process context, and then run the vtop plugin on a specific virtual address:
[1] swapper_test_paged_pde.aff4 17:24:41> cc proc_regex="swap"
Switching to process context: swapper.exe (Pid 2236@0xfa8000f47270)

[1] swapper_test_paged_pde.aff4 17:24:44>
vtop 0x000074770000

******************* 0x74770000 *******************
Virtual 0x000074770000 Page Directory 0x33a5a000
pml4e@ 0x33a5a000 = 0x2a00000383a9867
pdpte@ 0x383a9008 = 0x1500000384b0867
pde@ 0x384b0d18 = 0x117000003369a867
pte@ 0x3369ab80 = 0xf8a001b759280400
[_MMPTE_PROTOTYPE Proto] @ 0x00003369ab80
Offset Field Content
------ ------------------------------ -------
0x-1 Proto <_MMPTE Pointer to [0xF8A001B75928] (Pointer)>
0x0 Protection [Enumeration:Enumeration]: 0x00000000 (MM_ZERO_ACCESS)
0x0 ProtoAddress [BitField(16-64):ProtoAddress]: 0xF8A001B75928
0x0 Prototype [BitField(10-11):Prototype]: 0x00000001
0x0 ReadOnly [BitField(8-9):ReadOnly]: 0x00000000
0x0 Unused0 [BitField(1-8):Unused0]: 0x00000000
0x0 Unused1 [BitField(9-10):Unused1]: 0x00000000
0x0 Valid [BitField(0-1):Valid]: 0x00000000
[_MMPTE_SUBSECTION Subsect] @ 0xf8a001b75928
Offset Field Content
------ ------------------------------ -------
0x-1 Subsection <_SUBSECTION Pointer to [0xFA8000F75090] (Pointer)>
0x0 Protection [Enumeration:Enumeration]: 0x00000001 (MM_READONLY)
0x0 Prototype [BitField(10-11):Prototype]: 0x00000001
0x0 SubsectionAddress [BitField(16-64):SubsectionAddress]: 0xFA8000F75090
0x0 Unused0 [BitField(1-5):Unused0]: 0x00000000
0x0 Unused1 [BitField(11-16):Unused1]: 0x00000000
0x0 Valid [BitField(0-1):Valid]: 0x00000000
Subsection PTE to file C:\Users\mic\msvcr100.dll @ 0x0
Consider the example above. We first switch to the process context of the process with the name matching "swap". We then can see that Rekall is translating the pml4epdpdtpde to arrive at the pte. The pte contains the value 0xf8a001b759280400 which Rekall identifies as being in the PROTOTYPE state (As described previously a prototype PTE is like a symlink to another PTE which describes the real state of this virtual address).
Rekall then prints the _MMPTE_PROTOTYPE record indicating that the real PTE is found in virtual address 0xF8A001B75928. Rekall then identifies that PTE as a Subsection PTE and prints its content (A Subsection PTE is a placeholder for file mappings). The _MMPTE_SUBSECTION has a pointer to the subsection object for this file mapping.
Finally, in this case, Rekall does not have the file itself, hence we can not retrieve the content of this virtual address (On a real system, accessing the virtual address will cause the page fault handler to read the file into memory).
That was a simple example. Lets look at a more complex example:
[1] swapper_test_paged_pde.aff4 17:41:12> vtop 0x000000600000
******************** 0x600000 ********************
Virtual 0x000000600000 Page Directory 0x33a5a000
pml4e@ 0x33a5a000 = 0x2a00000383a9867
pdpte@ 0x383a9000 = 0x2f0000038a6c867
pde@ 0x38a6c018 = 0x213ff00200080
[_MMPTE_SOFTWARE Soft] @ 0x000038a6c018
Offset Field Content
------ ------------------------------ -------
0x0 InStore [BitField(22-23):InStore]: 0x00000000
0x0 PageFileHigh [BitField(32-64):PageFileHigh]: 0x000213FF
0x0 PageFileLow [BitField(1-5):PageFileLow]: 0x00000000
0x0 Protection [Enumeration:Enumeration]: 0x00000004 (MM_READWRITE)
0x0 Prototype [BitField(10-11):Prototype]: 0x00000000
0x0 Reserved [BitField(23-32):Reserved]: 0x00000000
0x0 Transition [BitField(11-12):Transition]: 0x00000000
0x0 UsedPageTableEntries [BitField(12-22):UsedPageTableEntries]: 0x00000200
0x0 Valid [BitField(0-1):Valid]: 0x00000000
Pagefile (0) @ 0x213ff000
pte@ 0x213ff000 @ aff4://c7201492-0876-45f4-ba90-a7cccec6453d/c:/pagefile.sys (Mapped 0x613ff000) = 0x1cee00000080
[_MMPTE_SOFTWARE Soft] @ 0x0000613ff000
Offset Field Content
------ ------------------------------ -------
0x0 InStore [BitField(22-23):InStore]: 0x00000000
0x0 PageFileHigh [BitField(32-64):PageFileHigh]: 0x00001CEE
0x0 PageFileLow [BitField(1-5):PageFileLow]: 0x00000000
0x0 Protection [Enumeration:Enumeration]: 0x00000004 (MM_READWRITE)
0x0 Prototype [BitField(10-11):Prototype]: 0x00000000
0x0 Reserved [BitField(23-32):Reserved]: 0x00000000
0x0 Transition [BitField(11-12):Transition]: 0x00000000
0x0 UsedPageTableEntries [BitField(12-22):UsedPageTableEntries]: 0x00000000
0x0 Valid [BitField(0-1):Valid]: 0x00000000
Pagefile (0) @ 0x1cee000
Physical Address 0x1cee000 @ aff4://c7201492-0876-45f4-ba90-a7cccec6453d/c:/pagefile.sys (Mapped 0x41cee000)
In this example, Rekall identifies the PDE at physical address 0x38a6c018 contains 0x213ff00200080. Since the PDE does not have bit 0 set - it is not valid. However, Rekall identifies that the PTE table resides in the pagefile at offset 0x213ff000. Note how Rekall maps the pagefile into the physical address space - by mapping the pagefile into the physical address space, the address transition process can simply refer to it by a single physical offset.
Rekall then reads the value of the PTE (from the pagefile) and finds that it is 0x1cee00000080. This again refers to the pagefile, this time at address 0x1cee000.
Note that in the second example we consulted the pagefile twice - once for reading the PTE table (referenced by a paged out PDE) and once by resolving the actual PTE which also refers to the pagefile. Being able to see the full transition process at work is extremely useful. As forensic analysts we must justify how we arrive at our conclusions and the vtop plugin allows us to do this.

How important is this?

We were previously surprised that correct address transition has not been implemented by other tools, and in particular by the lack of tools that are able to use the pagefile during analysis. Additionally, other researchers theorized that smear will be a big problem - there is a reasonably long time difference between aquiring the memory and acquiring the pagefile itself. Even we have previously observed that page tables may change between the two times causing the physical memory to be out of sync with the pagefile (we describe this as pagetable smear in the paper).
We wanted to check how many pages from the known VAD region can be recovered with and without the pagefile. We use the Rekall vaddump plugin to dump all vad regions for the swapper.exe process. We can then test how many pages were as expected and how many were incorrect (possibly due to smear) using the following python script:
import sys
import struct

i = errors = success =0
with open(sys.argv[1]) as fd:
while1:
i +=1
fd.seek(i *0x1000)
data = fd.read(8)
ifnot data:break

unpacked_data = struct.unpack("<Q", data)[0]
if unpacked_data != i:
errors +=1
else:
success +=1

print"Total errors: %s, Total success: %s"%(errors, success)
When using the pagefile, Rekall could correctly recover all but 3691 pages out of 202400 (error rate of 1.8%). However, without the pagefile, Rekall could only recover 119198 out of 202400 (41% error rate). We attribute most of the errors to acquisition smear in the case where the pagefile was used. However, this demonstrates that the pagefile is critical to collect and analyze - almost half the pages of interest were in the pagefile.

The AFF4 acquisition plugin

Our goal in acquisition is to preserve as much of system state as possible for later analysis. As we have seen, from the point of view of the address translation process, the system state comprises of:
  1. The physical memory.
  2. The pagefile.
  3. Any mapped files.
Previously, we used a dedicated imaging tool to acquire memory and the pagefile on the side. For example, the WinPmem 2.0.1 acquisition tool was written in C++ and acquired physical memory, while shelling out to the Sleuthkit’s fcat program to parse the NTFS file system when acquiring the pagefile (The pagefile is locked during normal system operation and can not be opened via the normal system APIs).
Quite independent of that, Rekall had for a long time the ability to perform live analysis: The raw physical memory device was used as a kind of memory image, and Rekall could perform triage live analysis without having to acquire memory first.
We have realized that in order to best preserve system state, especially on utilized systems, we should combine the two approaches to get a better copy of system state! Rekall can start to acquire the physical memory, then analyze the running system to determine which files are mapped and should be acquired additionally. Rekall now even parses the NTFS file system directly, and therefore can acquire locked files without using the OS APIs (There is no need to shell out to the Sleuthkit).
The final product is therefore an AFF4 volume containing physical memory as well as any mapped files and pagefile from the system. The AFF4 imaging format provides us with the required features, such as compression, sparse images (Physical memory is often sparse) and the ability to store multiple data streams in the same image format.
Now we can write a sophisticated memory acquisition tool right inside Rekall instead of having to rely on a dedicated imager. This is more powerful since we can leverage the triage and analysis capability in Rekall. It does come at a cost of increased complexity to the acquisition tool, and potentially increased footprint due to the larger executable size. However we believe this is a good trade off: Even if memory is forced to be swapped due to an increased footprint, we can just recover it from the pagefile anyway so we do not actually lose anything. We believe that when acquiring the pagefile and mapped files, demands on memory pressure and smaller tool footprint are less important. We will continue to maintain the old single program acquisition tool, which might be useful in some situations.
Consider acquiring memory now from the command line:
D:\AMD64>winpmem_2.0.1.exe -l
Driver Unloaded.
CR3: 0x0000187000
2 memory ranges:
Start 0x00001000 - Length 0x0009E000
Start 0x00100000 - Length 0x3FEF0000
Memory access driver left loaded since you specified the -l flag.

D:\AMD64>
rekal -f \\.\pmem aff4acquire c:\temp\image.aff4 --also_files
Will use compression: https://github.com/google/snappy
Imaging Physical Memory:
WinPmemAddressSpace: Wrote 0xc000000 (200 mb total) (11 Mb/s)
...
Wrote 1023 mb of Physical Memory to aff4://6567a47c-dd5d-4060-9a39-399fe735d959/PhysicalMemory
Imaging pagefile C:\pagefile.sys
pagefile.sys: Wrote 0x20b5a000 (548 total) (22 Mb/s)
Wrote pagefile.sys (1000 mb)
Adding file C:\Windows\System32\ntdll.dll
Adding file C:\Windows\SysWOW64\ntdll.dll
Adding file C:\Windows\System32\smss.exe
Adding file C:\Windows\System32\apisetschema.dll
Adding file C:\Windows\System32\locale.nls
Adding file C:\Windows\System32\en-US\cmd.exe.mui
Adding file C:\Windows\Globalization\Sorting\SortDefault.nls
Adding file C:\Windows\System32\kernel32.dll
...
Lets examine the content of the AFF4 image using the aff4imager tool:
$ aff4imager -V image.aff4
@prefix rdf: <http://www.w3.org/1999/02/22-rdf-syntax-ns#> .
@prefix aff4: <http://aff4.org/Schema#> .
@prefix xsd: <http://www.w3.org/2001/XMLSchema#> .

<aff4://6567a47c-dd5d-4060-9a39-399fe735d959/C%3A%5CProgram%20Files%20%28x86%29%5CMiranda%20IM%5CPlugins%5CGG.dll>
aff4:chunk_size 32768 ;
aff4:chunks_per_segment 1024 ;
aff4:compression <https://www.ietf.org/rfc/rfc1950.txt> ;
aff4:original_filename "C:\\Program Files (x86)\\Miranda IM\\Plugins\\GG.dll"^^xsd:string ;
aff4:size 316416 ;
aff4:stored <aff4://6567a47c-dd5d-4060-9a39-399fe735d959> ;
a aff4:image .

...
<aff4://6567a47c-dd5d-4060-9a39-399fe735d959/PhysicalMemory>
aff4:category <http://aff4.org/Schema#memory/physical> ;
aff4:stored <aff4://6567a47c-dd5d-4060-9a39-399fe735d959> ;
a aff4:map .

...
<aff4://6567a47c-dd5d-4060-9a39-399fe735d959/C%3A%5Cpagefile.sys>
aff4:chunk_size 32768 ;
aff4:chunks_per_segment 1024 ;
aff4:compression <https://github.com/google/snappy> ;
aff4:original_filename "C:\\pagefile.sys"^^xsd:string ;
aff4:size 1380974592 ;
aff4:stored <aff4://6567a47c-dd5d-4060-9a39-399fe735d959> ;
a aff4:image .
We can see an example of a file stream ("C:\\Program Files (x86)\\Miranda IM\\Plugins\\GG.dll"), the physical memory stream, and the pagefile are also acquired.

Conclusions

In this blog post we discussed Rekall’s advanced virtual address transition algorithms. To our knowledge, Rekall is the only open source memory analysis framework to support incorporating the pagefile and mapped files. We also discussed the new aff4acquire plugin which aims to simplify the process of memory acquisition and ensure that more relevant evidence is collected automatically during acquisition time, to complete subsequent analysis.
We have also shared some test images, and examined some cases where address transition is particularly complex.
We hope to convince you, the reader, that properly supporting the pagefile is critical for accurate memory analysis! In Rekall we choose to have a strong and solid foundation on top of which we can develop better memory analysis techniques. In the next blog post we will discuss how this foundation can be used in order to reliably analyze user space heap allocations.

XEN ParaVirtualization support in Rekall

$
0
0
If you've ever taken a memory image of a Linux virtual machine that's running under XEN in paravirtualization mode and you've tried to analyze it you'll have noticed most of your plugins don't work (if any).

[1] XEN-testmachine-PVguest.mem 14:20:42> pslist
ERROR:rekall.1:No profiles match this image. Try specifying manually.
---------------------------------------------------------------------------
RuntimeError                              Traceback (most recent call last)
[...]
RuntimeError: Unable to find a valid profile for this image. Try using -v for more details.


The reason is that XEN's page tables are funky. XEN uses a technique known as direct mapping which significantly differs from how memory management is done in many other virtualization solutions.

"In order to virtualise the memory subsystem all hypervisors introduce an additional level of abstraction between what the guest sees as physical memory (often called pseudo-physical in Xen) and the underlying memory of the machine (machine addresses in Xen). This is usually done through the introduction of a Physical to Machine (P2M) mapping. Typically this would be maintained within the hypervisor and hidden from the guest Operating System through techniques such as the use of Shadow Page Tables."

So instead of trapping every single memory access from the guest and having the hypervisor do an additional translation, XEN uses a different model:
"The Xen paravirtualised MMU model instead requires that the guest be aware of the P2M mapping and be modified such that instead of writing page table entries mapping virtual addresses to the (pseudo-)physical address space it would instead write entries mapping virtual addresses directly to the machine address space by mapping performing the mapping from pseudo physical to machine addresses itself using the P2M as it writes its page tables. This technique is known in Xen as direct paging."


What direct mapping means is that instead of having page tables where each entry points to physical memory of the guest, XEN's page tables point to the physical memory of the host.


But, why does XEN do this? The answer is performance.
Because the guest kernel knows it's virtualized and can cooperate with the hypervisor, XEN can afford cheating in virtualization. Knowing the presence of and cooperating with the hypervisor is one of the strong points of paravirtualization. It requires modification of the guest kernel but provides opportunities for speed improvements. 

The guest kernel is allowed to know and use the host's physical memory for page table upkeeping. In exchange, it has to perform the upkeep of the page tables in cooperation with the host. This way no heavy translation mechanism like shadow pages tables must be used.

However, you can imagine that tinkering with the hosts's memory may allow a hostile kernel to subvert the host. XEN keeps the guest kernel in control because it runs in ring-3 and it is not allowed to directly write into the host memory. Instead, it must issue a hypercall, a call to the hypervisor, whenever it needs to update them. The hypervisor performs sanity checks to make sure the guest kernel request to modify page tables is not attempting to subvert the hypervisor itself or other VMs.

Throughout the article we'll be using XEN's terminology:
  • XEN refers to the physical memory of the host as machine memory.
  • The physical memory of the guest is called "pseudo-physical" or simply "physical" memory. To prevent confusion, we'll refer to guest physical memory as (pseudo-)physical.

XEN's direct mapping vs normal mapping

Let's deep dive into direct mapping. We'll compare how the page tables look in AMD64 vs how they look in a XEN guest. The host machine is 64 bits, runs the 3.13 kernel and has 32GB of ram, the guest has 256MB and runs kernel 3.2. All examples will be in the Rekall console.

Let's start by using a kernel symbol on a real machine and look how the MMU would translate it. We've picked linux_proc_banner, which is a kernel symbol that points to a format string (%s version %s) for the kernel version. It's a symbol present in all kernels and is what helps build the string in /proc/version.

To validate the expected address, we'll use the PAGE_OFFSET trick:

[1] kcore 13:03:23> hex(session.profile.get_constant("linux_proc_banner"))
             Out<6> '0xffffffff81800040L'

[1] kcore 13:03:46> hex(session.profile.get_constant("linux_proc_banner") - session.profile.GetPageOffset())
             Out<8> '0x1800040L'

linux_proc_banner is in 0xffffffff81800040 which corresponds to physical address 0x1800040L.


Despite this trick, while the system is running any virtual address translation is still done by the MMU. Let's use the vtop plugin to show the virtual address resolution just like the MMU would do. vtop outputs debug information about every step of the 2 or 3 level address translation:

[1] kcore 13:03:50> vtop(0xffffffff81800040L)

*************** 0xffffffff81800040 ***************
Virtual 0xffffffff81800040 Page Directory 0x1c0e000 (the DTB)
pml4e@ 0x1c0eff8 = 0x1c11067                         (1st step translation)
pdpte@ 0x1c11ff0 = 0x1c12063                         (2nd step translation)
pde@ 0x1c12060 = 0x80000000018001e1                  (3rd step translation)
Large page mapped
Physical Address 0x1800040                           (4th step, actual physaddr)

Deriving physical address from runtime physical address space:
Physical Address 0x1800040

vtop shows us that the physical address indeed 0x18000040 as we predicted earlier. And also that each of the different steps of the translation are within physical memory (0x1c1XXXX is around 29M).

Note that the value of the pde in this case (0x80000000018001e1) is not an actual physical address. The physical address part of the pde value are only the following bytes 0x80000000018001e1.

Page tables in XEN


So how does this look in a XEN guest? We're going to do all this for a 3.2 XEN kernel with a Rekall version without XEN support (I disabled it on purpose). For starters, let's list the available physical memory ranges:

[1] XEN-testmachine-PVguest.mem 11:10:09> for (pa, va, sz) in session.physical_address_space.get_address_ranges():
        print "%s - %s" % (hex(pa), hex(pa+sz))
                                      |.> 
0x0 - 0x10000000

If we are to inspect this image, DTB validation will most likely fail, but we can do the validation ourselves.
In AMD64, the DTB is identified by the symbol init_level4_pgt.

[1] XEN-testmachine-PVguest.mem 11:10:32> hex(session.profile.get_constant("init_level4_pgt"))
                                   Out<8> '0xffffffff81c05000L'

[1] XEN-testmachine-PVguest.mem 11:10:50> hex(session.profile.get_constant("init_level4_pgt") - session.profile.GetPageOffset())
                                   Out<9> '0x1c05000L'

The DTB should be 0x1c05000. Now, let's get the symbol for linux_proc_banner for this image:

[1] XEN-testmachine-PVguest.mem 11:11:16> hex(session.profile.get_constant("linux_proc_banner"))
                                  Out<10> '0xffffffff81800020L'

Meaning its physical address should end up being 0x18000e0. Let's try to validate this:

[1] XEN-testmachine-PVguest.mem 11:11:37> session.physical_address_space.read(0x1800020, 14)
                                  Out<12> '%s version %s '

Perfect!

Now, we have to see what the MMU would see. That is, what the translation following the DTB at 0x1c05000 would say:

[1] XEN-testmachine-PVguest.mem 11:12:06> from rekall.plugins.addrspaces import amd64
[1] XEN-testmachine-PVguest.mem 11:12:09> adrs = amd64.AMD64PagedMemory(dtb=0x1c05000, session=session, base=session.physical_address_space)
[1] XEN-testmachine-PVguest.mem 11:12:10> t = session.GetRenderer()
[1] XEN-testmachine-PVguest.mem 11:12:21> with t:
    for x in adrs.describe_vtop(0xffffffff81800020L):
        x.render(t)
                                     |..> 
pml4e@ 0x1c05ff8 = 0x28417067
pdpte@ 0x28417ff0 = 0x0
Invalid PDPTE

pde@ 0x60 = 0x0


As you can see, at the first translation returns a physical address that's not in the physical memory range. 0x28417067 is 6.7GB. Way above 256M.

When we try to read from an address so high "pdpte@ 0x153ec19ff0" returns 0. It's not that there's a 0 in that address, it's something Rekall does when the you try to read from an invalid address.

0x28417067 is, in fact, pointing to the host's physical memory. That is, this is a machine address.
However, we only have access to (pseudo-)physical memory, the physical memory of the guest.

Here's what's happening:


Because the page tables point to the host's physical memory, we can't resolve them directly from the page tables as usual.

So how do we solve this?

Enter XEN translation


As was mentioned at the start, XEN maintains a mapping of (Pseudo-)Physical to Machine addresses called a P2M mapping.

What we need is a machine to (pseudo-)physical mapping. Or M2P.

Both the P2M mapping and M2P mapping are pointed by symbols accessible from the guest kernel. However, there's an important difference. Let's take a look at them:

[1] XEN-testmachine-PVguest.mem 11:13:35> hex(session.profile.get_constant("p2m_top"))
                                  Out<21> '0xffffffff81ddede8L'

p2m_top is a pointer. Let's see where it points to:

[1] XEN-testmachine-PVguest.mem 11:14:44> hex(0xffffffff81d41de8L - session.profile.GetPageOffset())
                                  Out<23> '0x1d41de8L'          (physical address of p2m_top)
[1] XEN-testmachine-PVguest.mem 11:15:18> hex(struct.unpack_from("<Q", session.physical_address_space.read(0x1ddede8L, 8))[0])
                                  Out<27> '0xffffffff81f2e000L' (where p2m_top points to)

p2m_top points to 0xffffffff81f2e000. It corrresponds to 0x1e53000 in physical memory, which is within pseudo physical memory, so we can reach it. Let's see about machine_to_phys_mapping (M2P):

[1] XEN-testmachine-PVguest.mem 12:34:06> hex(session.profile.get_constant("machine_to_phys_mapping"))
                                   Out<2> '0xffffffff81c0f808L'

machine_to_phys_mapping is also a pointer. Let's see where it points to:

[1] XEN-testmachine-PVguest.mem 12:34:07> hex(session.profile.get_constant("machine_to_phys_mapping") - session.profile.GetPageOffset())
                                   Out<3> '0x1c0f808L'
[1] XEN-testmachine-PVguest.mem 12:35:10> hex(struct.unpack_from("<Q", session.physical_address_space.read(0x1c0f808L, 8))[0])
                                   Out<7> '0xffff800000000000L'

Ok, machine_to_phys_mapping is a pointer to 0xffff800000000000. Well, that's a problem:
  1. You can't translate this address back to physical memory via the PAGE_OFFSET method.
  2. You can't translate it directly via the MMU:

[1] XEN-testmachine-PVguest.mem 12:35:11> t = session.GetRenderer()
[1] XEN-testmachine-PVguest.mem 12:39:09> from rekall.plugins.addrspaces import amd64
[1] XEN-testmachine-PVguest.mem 12:39:13> adrs = amd64.AMD64PagedMemory(dtb=0x1c05000, session=session, base=session.physical_address_space)
[1] XEN-testmachine-PVguest.mem 12:39:16> with t:
    for x in adrs.describe_vtop(0xffff800000000000L):
        x.render(t)
                                     |..> 
pml4e@ 0x1c05800 = 0x7fff9067      (outside the guests's phys memory range :( )
pdpte@ 0x7fff9000 = 0x0
Invalid PDPTE
pde@ 0x0 = 0x0

So how can you access machine_to_phys_mapping? You need to do it on the live system, from the kernel. But there's 2 problems with the current capabilities:

  1. When analyzing live memory, /dev/pmem only maps physical memory, so we can't ask the kernel to read from this address.
  2. When analyzing live memory, /proc/kcore doesn't map it either 

We have 2 options:
  1. Provide a driver that allows reading of virtual addresses. A /dev/vmem of sorts.
  2. Use P2M, which we can access, and try inverting it. After all, M2P should be a reverse P2M.
Since solution [1] means we have to compile a new module for every new kernel version and insert it and we like solutions that work universally out of the box, we explored [2].

Inverting P2M

As explained in arch/x86/xen/p2m.c, p2m_top is essentially a 3-level tree to perform (pseudo-)physical to machine address resolution. Very much like virtual to physical translation works in x86, p2m_top translates (pseudo-)physical addresses to machine addresses. What we're looking for is the reverse: a machine to guest physical translation, or M2P.

p2m_top takes a PFN, a (pseudo-)physical frame number and translates it to an MFN, a machine frame number. So we experimented with code to parse it and here's some debug information for a single resolution of PFN(0) to MFN:

p2m_top[0] = 0xffffffff81f30000
p2m_top[0][0] = 0xffffffff84673000
p2m_top[0][0][0] = 0x7f328

What this means is that the guest's address range 0 - 0x1000 corresponds to the hosts'0x7f328000 - 0x7f328FFF range. If we reverse this: that whenever we have a reference to host addresses in the 0x7f328000 - 0x7f328FFF range, we can find them on the guest's physical memory starting at offset 0. So if we ever find a reference in the page tables to 0x7f328000, now we know where to find it.

As you can see, we were able to follow the p2m_top tree completely for the first entry. All addresses were within addressable space in the guest kernel memory.

And, in fact, if we repeat this for the rest of the tree and invert it we can now resolve all machine to (pseudo-)physical translations.

Now, remember the vtop we did earlier?

[1] XEN-testmachine-PVguest.mem 14:04:41> with t:
        for x in adrs.describe_vtop(0xffffffff81800020L):
                x.render(t)
                                     |..>

pml4e@ 0x1c05ff8 = 0x28417067
pdpte@ 0x28417ff0 = 0x0
Invalid PDPTE

pde@ 0x60 = 0x0


We didn't know where to fetch 0x28417067 (6.5GB) as it's past the guest physical memory (remember, it's a machine address pointing to the host). However, once we've parsed the P2M and reverted it, we now know how to convert it back to a physical address:

[1] XEN-testmachine-PVguest.mem 14:04:46> hex(session.kernel_address_space.m2p_mapping[0x28417])
                                  Out<15> 0x1c07

This means machine frame number 0x28417 corresponds to physical frame number 7175 (0x1c07).

In plain words, whenever the page tables refer to an address between 0x28417000 and 0x28417FFF we can find its actually backed in the guest's physical memory between 0x1c07000 and 0x1c07FFF0x1c07000 is 29MB which is well within the guest's physical memory, as it should.

Once we implemented detection of XEN ParaVirtualization and automatic address translation after parsing of the P2M tables, we were able to examine XEN guests transparently from within the guest by just accessing it's (pseudo-) physical memory. Which means this approach also works when doing live analysis.

And with the current implementation in the Rekall HEAD, what you'll see instead is:

[1] XEN-testmachine-PVguest.mem 16:22:36> session.kernel_address_space
                                   Out<3> <XenParaVirtAMD64PagedMemory @ 0x7fab1dc5c49 Kernel AS@0x1c05000>
[1] XEN-testmachine-PVguest.mem 16:22:34> vtop(0xffffffff81800020)

*************** 0xffffffff81800020 ***************
Virtual 0xffffffff81800020 Page Directory 0x1c05000

(XEN resolves MFN 0x28417067 to PFN 0x1c07067)
pml4e@ 0x1c05ff8 = 0x1c07067

(XEN resolves MFN 0x28413067 to PFN 0x1c0b067)
pdpte@ 0x1c07ff0 = 0x1c0b067
pde@ 0x1c0b060 = 0x4705067
pte@ 0x4705000 = 0x1800025
Physical Address 0x1800020

Deriving physical address from runtime physical address space:
Physical Address 0x1800020

[1] XEN-testmachine-PVguest.mem 16:22:34> pslist

  Offset (V)      Name      PID    PPID   UID    GID        DTB             Start Time
-------------- ----------- ------ ------ ------ ------ -------------- ----------------------
0x88000ef10000 init           1      0      0      0 0x00000ba56000 2015-01-30 12:10:24+0000
0x88000ef11700 kthreadd       2      0      0      0 -              2015-01-30 12:10:24+0000
0x88000ef12e00 ksoftirqd/0    3      2      0      0 -              2015-01-30 12:10:24+0000
0x88000ef14500 kworker/0:0    4      2      0      0 -              2015-01-30 12:10:24+0000
0x88000ef15c00 kworker/u:0    5      2      0      0 -              2015-01-30 12:10:24+0000
0x88000ef30000 migration/0    6      2      0      0 -              2015-01-30 12:10:24+0000
0x88000ef31700 watchdog/0     7      2      0      0 -              2015-01-30 12:10:24+0000
[...]

We added initial support for analyzing XEN paravirtualized guests earlier in 2015 and we've been improving and refining it.You can see XEN support in action in our TAP server (xen image). An example: pslist.

Conclusions

In this blog post, we've presented the challenges found in analyzing virtual machines running under XEN paravirtualized model.

We also discussed two methods to overcome them and how we implemented support for 64bits XEN paravirtualization in Rekall.

Over time we've discovered some issues with our approach, specially with later kernels in the 3.X branch that I'll discuss in a follow-up article.

Let us know if you've used this functionality with success and want to give us thumbs up or if you've encountered problems, so we can help you solve them. Note that we don't support XEN PV for the 2.6.X branch at the moment.

Installing Rekall on Windows

$
0
0
In the past developing and compiling python software on Windows was a troubling process. Getting the python environment setup just right was quite tricky since one had to install MS Visual Studio, then get python to use it for building C code. The whole thing was fragile and hard to get right. This is why we traditionally ship Windows installers for Rekall.

These days the situation is much better. The new python setuptools integrates well with Visual Studio, and Microsoft is now shipping a free, stripped down version of Visual Studio that can be used to build python extensions (the whole thing is 85mb without any of the GUI stuff in it).

It is pretty easy to install Rekall from source on Windows and this blog post will illustrate the process. We also show how the binary distribution can be built from source using the installer.

Finally, we also cover how you could build a stand-alone version of Rekall which can be packaged on a USB drive or CD ROM in order to respond to incidents.

Starting with a clean Windows machine


I have built a fresh new virtual machine with Windows 8.1. The first step is to install python itself from http://www.python.org :


Download and install for all users. This typically stores the python installation in C:\Python27\
Next we show how to track the latest version of Rekall - download Git for Windows:

Get the clone URL from the Rekall github page:

Now clone the source to your home directory:

It is recommended that python development always use virtual env. If you are not familiar with Virtual Env it is a neat system which allows you to run a fairly isolated python installation inside a directory. This way it is possible to run several python projects with different and even conflicting dependencies. Once a virtual environment is activated, python code is run from within the environment's directory instead of from the system python installation.

A Typical procedure for setting up a development environment is:
  1. install virtualenv using the system's pip (This will install virtualenv in the system's python).
  2. Use virtualenv to create a new environment (A new directory with the necessary skeleton files to serve as the new environment). The new environment has only python and pip and so everything must be installed again in it. This helps to ensure that the environment is started with a clean slate, and all package dependencies are explicitly defined.
  3. The new environment is activated by running the <VirtualEnv Dir>/Scripts/activate script. Any new pip packages will be installed into this environment. (NOTE: Running a python program by association will run it with the system python. If you want to run a python script inside the virtual environment you should preceed the script name with python). eg:
      1. C:\> setup.py install       ← Runs the system's python and installs into the system's main directory (C:\Python27\)
      2. C:\> python setup.py install      ← Runs the virtualenv's python and installs into the virtualenv.

The Rekall source tree actually contains several packages with different setup.py files. The core of Rekall is in rekall/rekall-core/ so change to that directory and install. The installer will try to compile some C files and will probably fail at this point because it is trying to use Visual Studio to compile this but we don't have it installed yet.

In the old days this is the point where you have to mess with environment variables to get it to find the Visual Studio installation, but these days there is a special package shipped by Microsoft to make this process smoother. The installer even tells you where to get it:
Download and install it:
Now compilation should proceed without any problems:
Let's test our Rekall installation by doing some live analysis. First open an Administrator shell:
Now we need to activate our virtual environment inside this shell. The Rekall we just installed lives inside the virtual environment and therefore requires it to be activated.

We then run rekall -v live. The -v flag means to report verbose logging, while the live plugin tells Rekall to insert a driver and attach to it automatically.
We can run a simple plugin, say pslist:
Note that since the entire Rekall installation and all its dependencies are installed in the virtual environment you can simply blow it all away by removing the environment and making a new one (and activating it). This allows you to test building and installing packages from a clean system each time.

Another useful feature is to run "python setup.py develop". This sets the virtual environment up such that it will use the git repository for the python files. Therefore when you make a change in a python file, the change will be picked up immediately without needing to reinstall into the virtual environment.

Alternatively if you do not want to install the latest source, and only want to have the released version installed you may simply issue "pip install rekall" to have the latest rekall release and all its dependencies installed into the virtual environment.

Building the Windows binary installation.

Rekall is normally shipped with a nice installer which installs a pyinstaller built self contained binary package. This is a nicer way to deliver Windows applications because it does not require any special software like python to be pre-installed.

In order to build the nice windows installer, we need to install inno setup - the installer creator tool:

Finally we install pyinstaller with pip, and simply run the rekall winbuild.py script from the tools\installers\winbuild.py
Hopefully a windows installer is waiting for us:

Building a stand alone version of Rekall.

Sometimes when responding to incidents we want to have all our tools on a CDROM, file share or a USB drive and do not want to install anything on the system. In particular we sometimes do not want Rekall to go to the network by itself - e.g. to get a profile from the profile repository or the Microsoft Symbol Server.

How can we configure Rekall so it does not write on the system it is trying to analyze?

This is quite easy actually - all we need to do is to give Rekall all it needs and configure where it looks for things.  Rekall needs two main things to run:
  1. Access to the profile repository - this can be over the web, or to a local directory.
  2. Access to a cache directory to store temporary files. You can either choose to provide a cache directory (e.g. on a writable USB drive) or not (in which case there will only be an in-memory cache - i.e. non persistent).

Obtaining a copy of the profile repository

If you don't want Rekall to contact the public profile repository, simply download a local copy. The profile repository is hosted on github so it can be git cloned:

git clone --depth 1 https://github.com/google/rekall-profiles

You can keep the repository up to date by periodically running git pull in that directory.

Let's create a new directory to store the AMD64 build of Rekall. We can copy the binaries created in the previous step (This assumes you built using the 64 bit python version).
The next step is ensuring that Rekall uses somewhere safe to write on. Normally rekall opens its configuration file in the user's home directory, but in this case we want to prevent Rekall from touching the user's home directory.

Rekall searches for its configuration file (.rekallrc) in the following locations:
  1. The directory of the Rekall executable.
  2. Current directory.
  3. The user's home directory. This is either taken from environment variables or can be set via the --home command line parameter.
  4. /etc/rekallrc for system wide configuration.

Note that if Rekall does not find a configuration file it creates a default file in the user's home directory (~/.rekallrc) and also a local cache directory in the user's home directory (~/.rekall_cache).

In our case we override the configuration by placing the .rekallrc right next to the executable itself. 

The following configuration file places the home directory in the standalone directory (i.e. assuming we run from the standalone\AMD64\ directory), and then specifies the repository path and cache relative to that home directory. This configuration is suitable for a writable standalone USB drive (For example, this entire directory can be copies to a USB drive).

# This forces Rekall to assume your home directory is ../ .
home: ../

repository_path:
 - $HOME/rekall-profiles/

# Do not use a persistent cache.
cache: memory

# We do not want to contact MS symbol server at all
autodetect_build_local: none

# Where Rekall will store cached files.
cache_dir: $HOME/rekall_cache/

When responding to an incident one has to simply mount the USB drive, change to the appropriate directory (e.g. D:\standalone\AMD64) and run rekal.

One of the first things you should do is acquire a memory image. This will acquire memory, pagefiles and any mapped files into the AFF4 image:

D:\standalone\AMD64> rekal aff4acquire my_image.aff4 --also_files

Building 32 bit windows binaries

The process for building x86 binaries is exactly the same as with 64 bit binaries, except one has to start with the 32 bit python distribution. I usually install the 32 bit python installation into C:\Python27.32 to keep it separate from the 64 bit installation.  The binaries can be similarly copied into the standalone directory under e.g. I386.

Building OSX binaries

For OSX, one can similarly build binaries by running the script in tools/installers/darwinbuild.sh. The result is a directory containing a pyinstaller built Rekall, which can be placed into the standalone directory similarly to the Windows example above.

Viewing all 27 articles
Browse latest View live